


Revenue analytics dashboard
Contents
We'll remove the Revenue analytics dashboard on or after June 30th, 2026.
We're not stepping away from revenue in PostHog — we're rethinking how it should work. Instead of maintaining a single, opinionated Revenue analytics dashboard, we're focusing on exposing revenue properties on persons and groups so you can use them everywhere: insights, SQL, and persons/groups profiles. Each use case (ecommerce, SaaS, recurring revenue, one-off, services, multi-tenant) can then build the dashboard it actually needs — or have PostHog AI and agents via our MCP build it for you.
The revenue analytics dashboard provides an overview of your revenue data.
For the selected time range, it starts with the total revenue made alongside how many paying customers you have and the average revenue for each of them in that period.
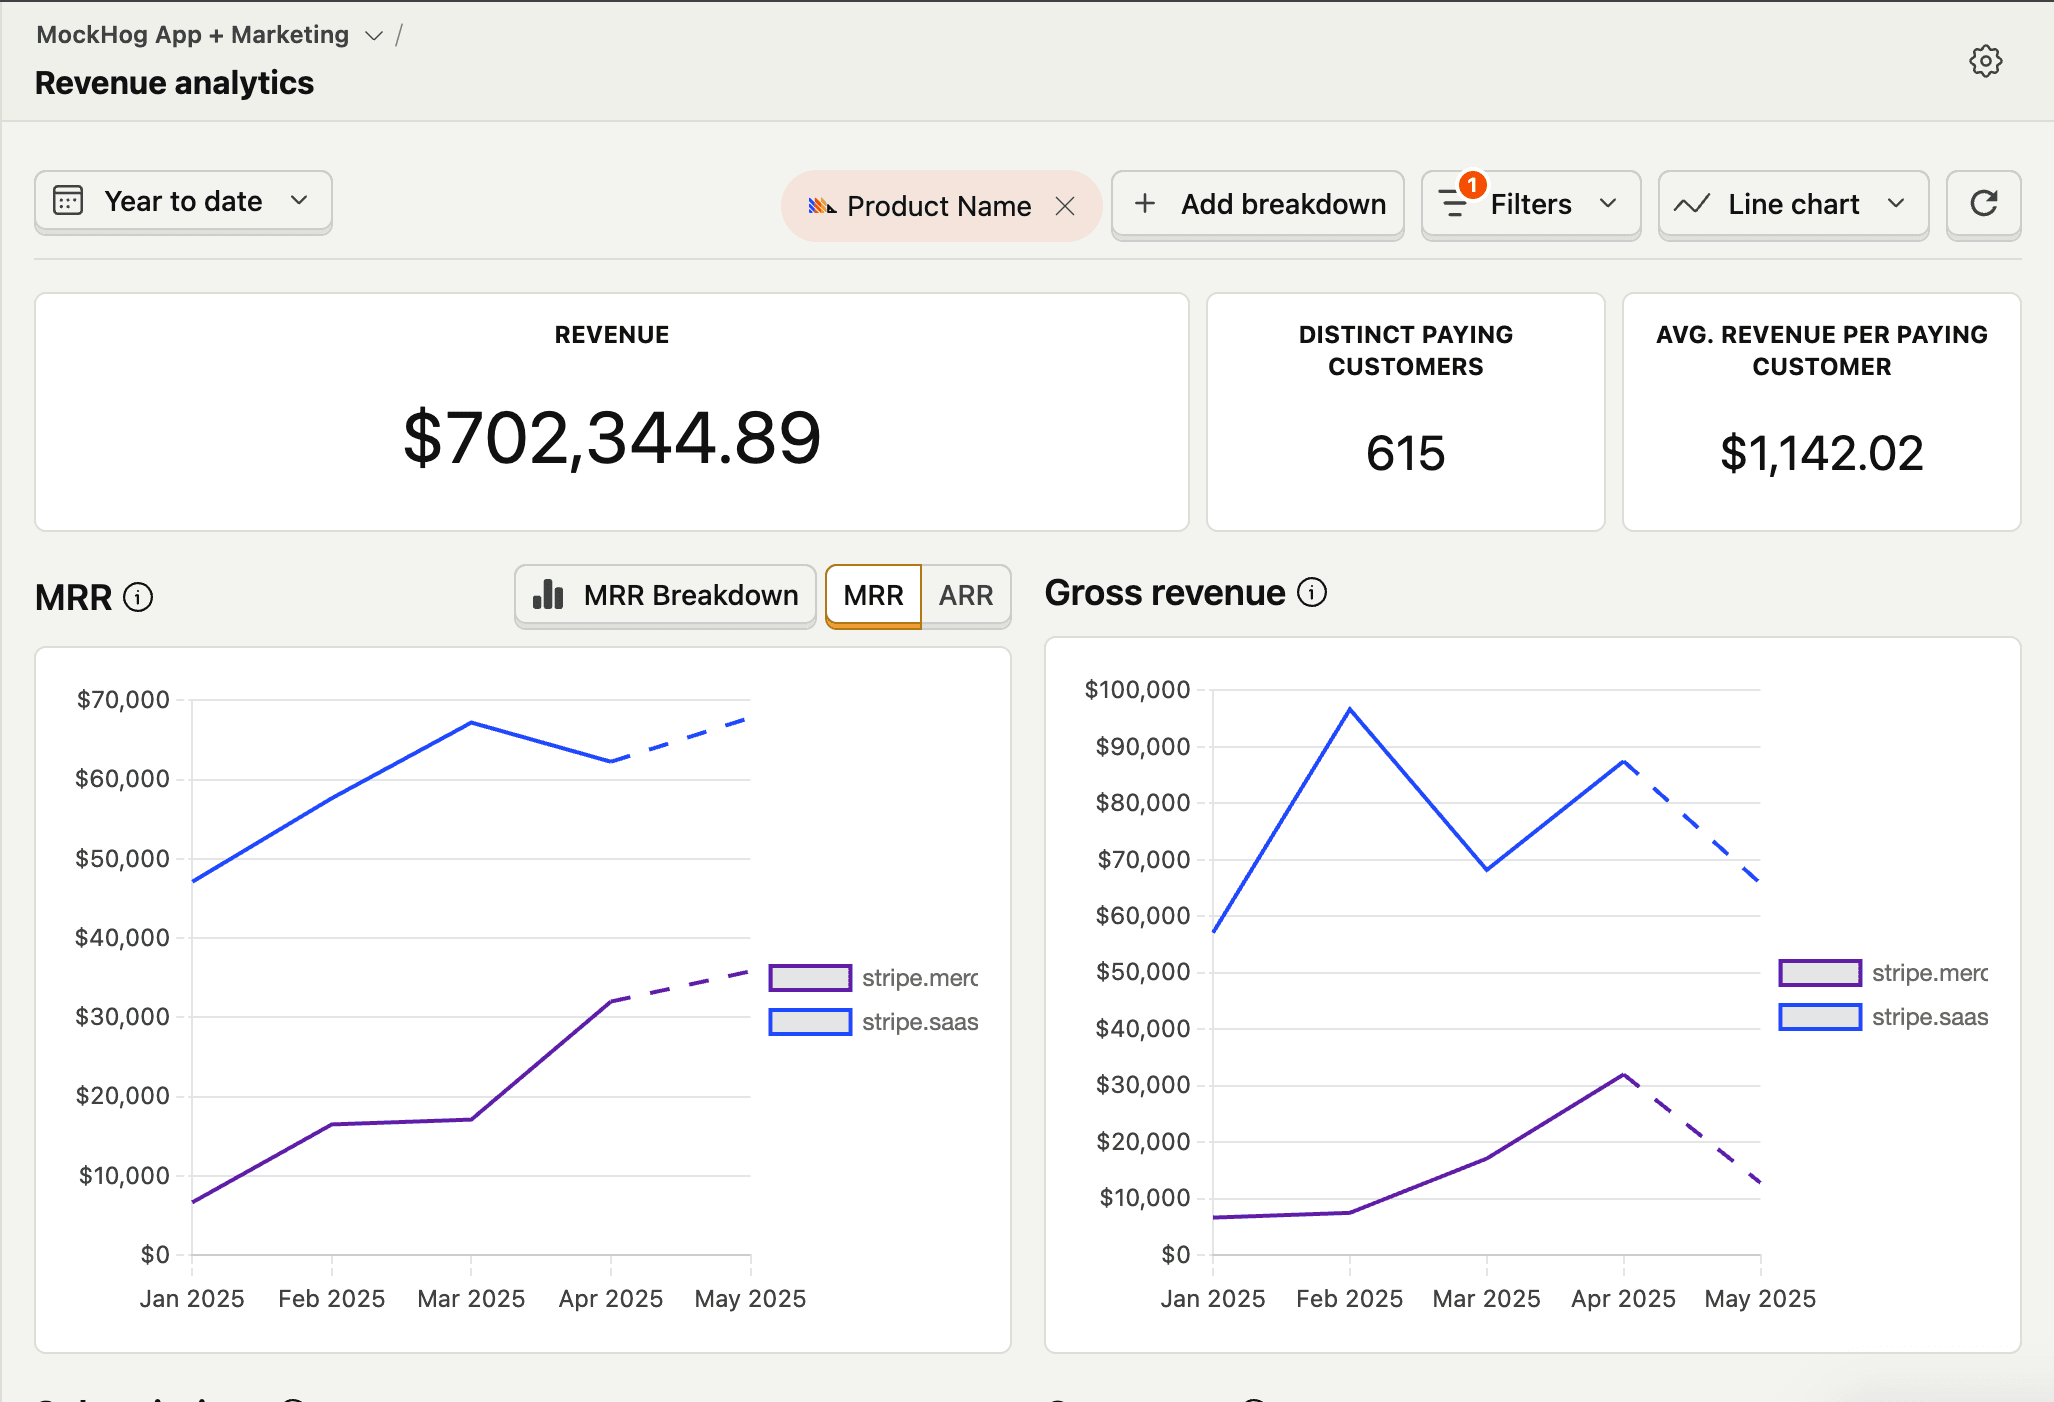
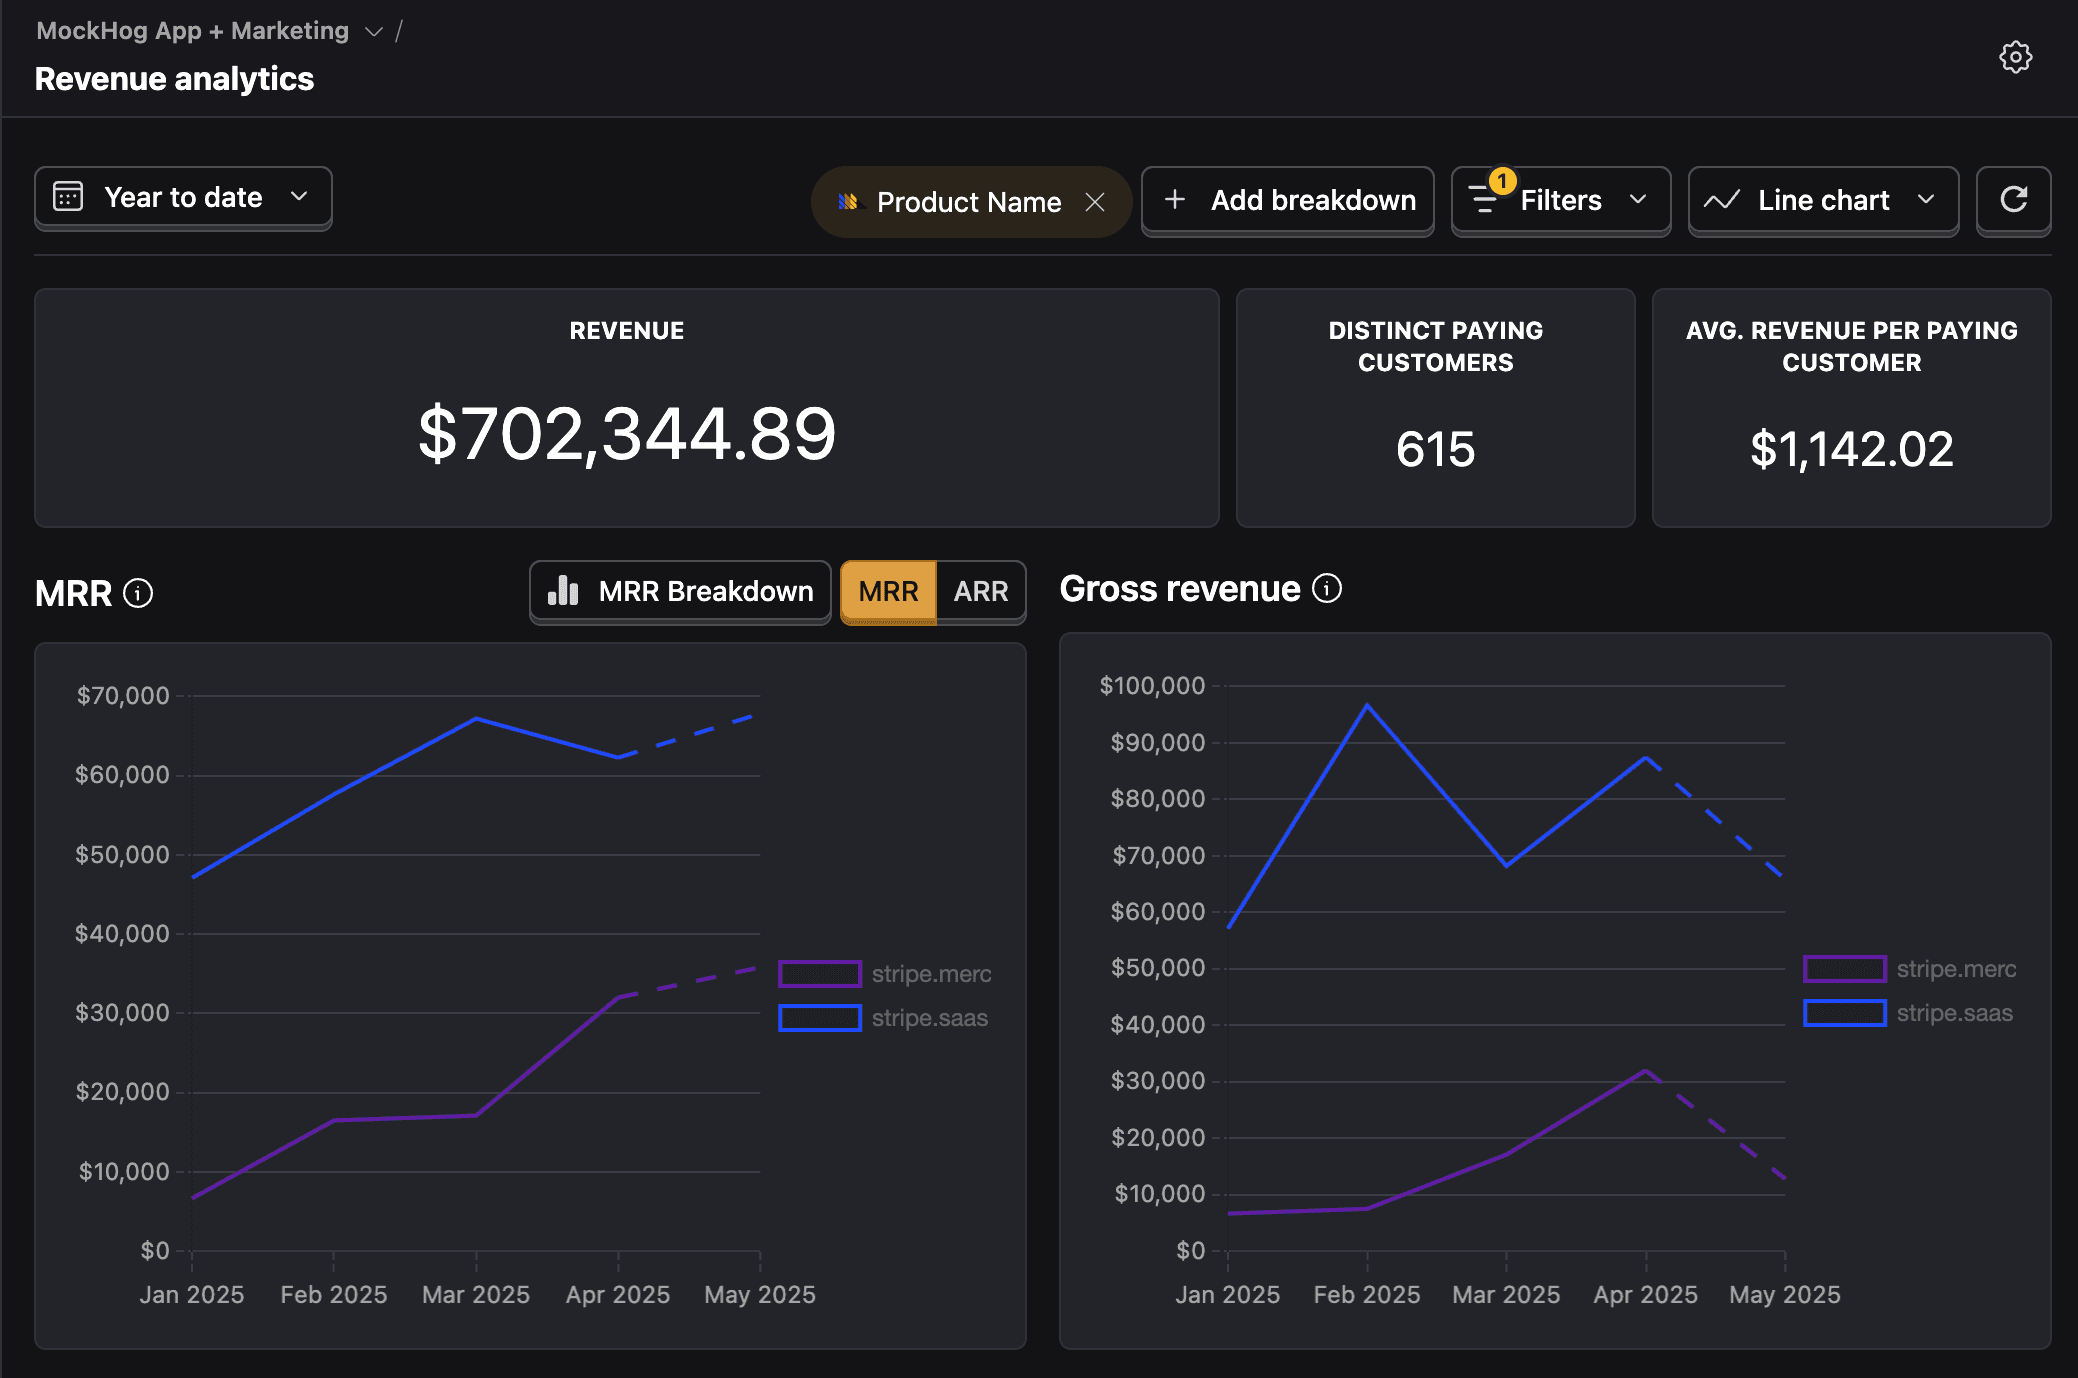
Filters and breakdowns
Like other dashboards in PostHog, the revenue analytics dashboard is filterable. This means you can filter for data with certain event or person property values. Some options include:
- Product name
- Initial coupon
- Customer ID
- Transaction amount.
You can filter by clicking the Add filter button next to the date range at the top of the dashboard.
For more complex queries, you can still use product analytics insights or the SQL editor as usual.
You can also break down your revenue by different properties to see what your revenue looks like for each of your individual products/plans/customers, etc..
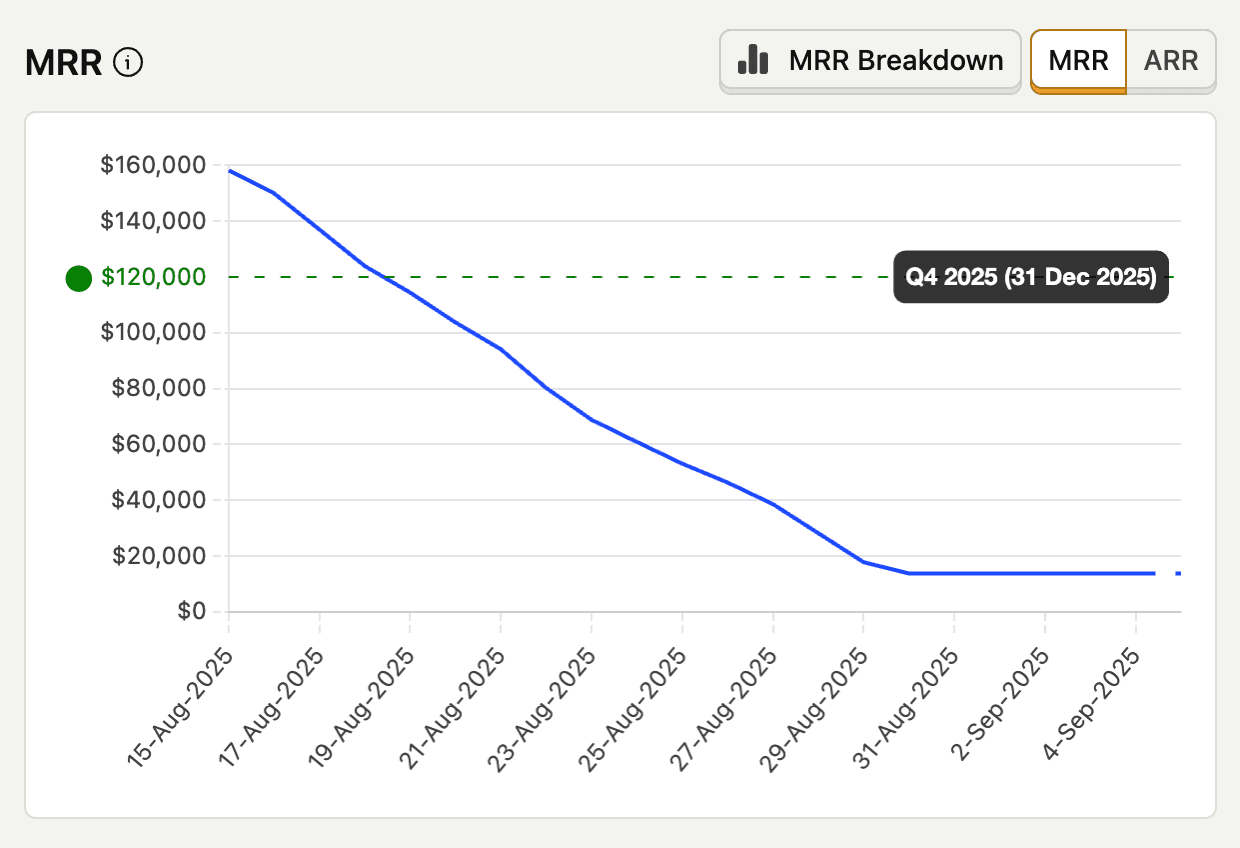
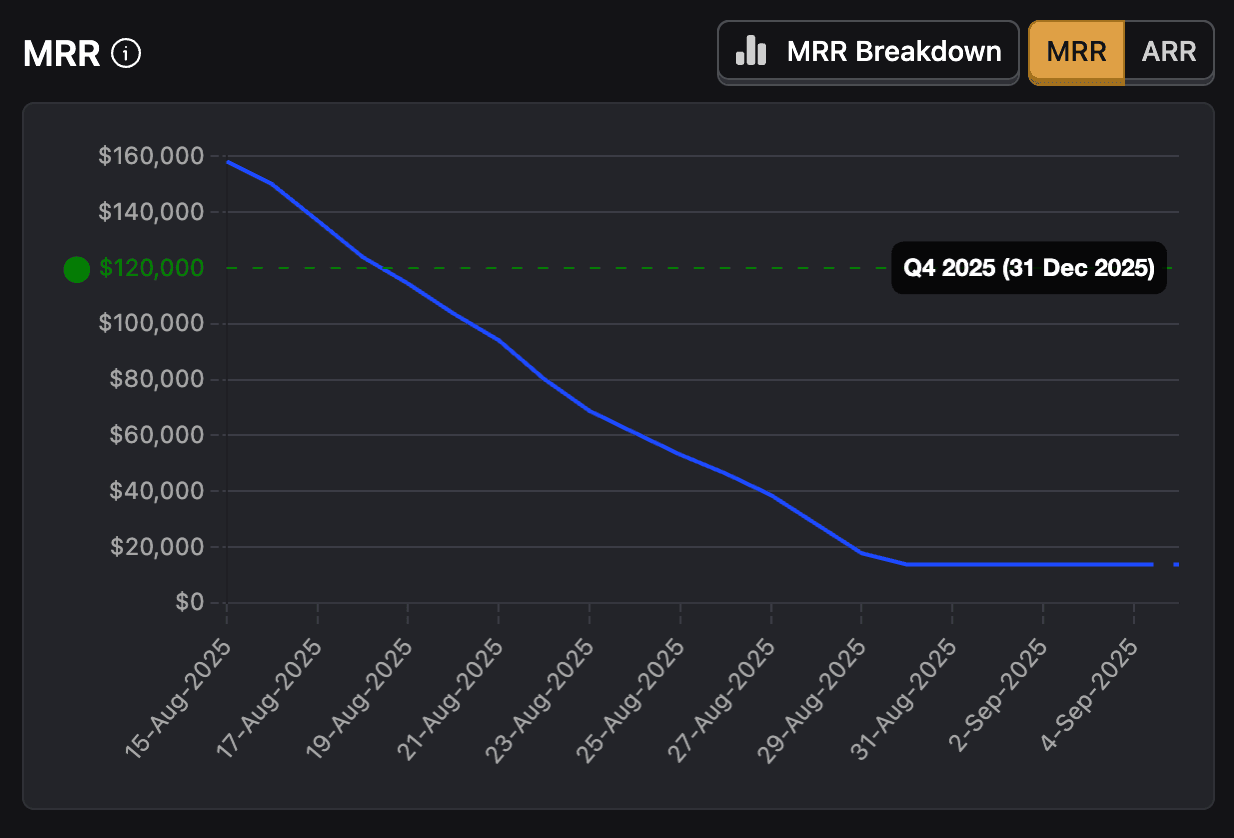
MRR and ARR
The first metric you can see is your Monthly Recurring Revenue (MRR) for each of the data points. This is how much money you're making from customers with active subscriptions.
This is automatically calculated by PostHog based on the revenue data you send us. For event sources, the MRR is only included if you configure a revenue event with a subscription property.
When breaking down your data per month, we report what that amount was on the last day of the month.
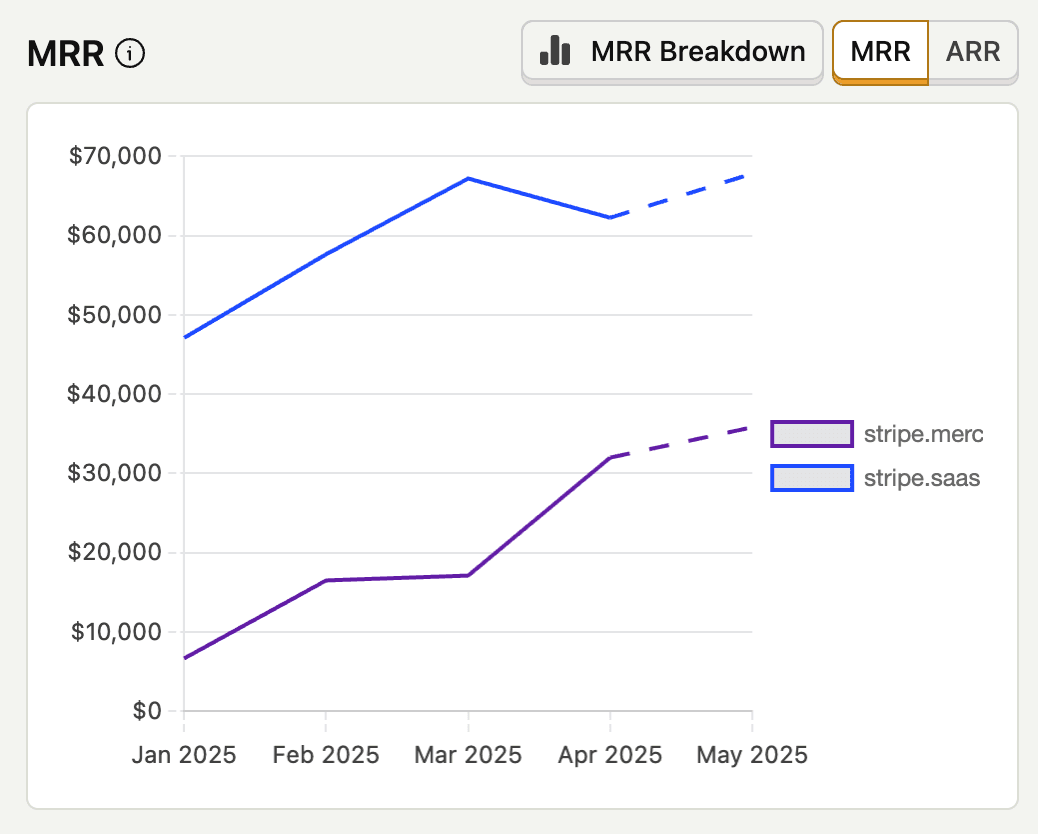
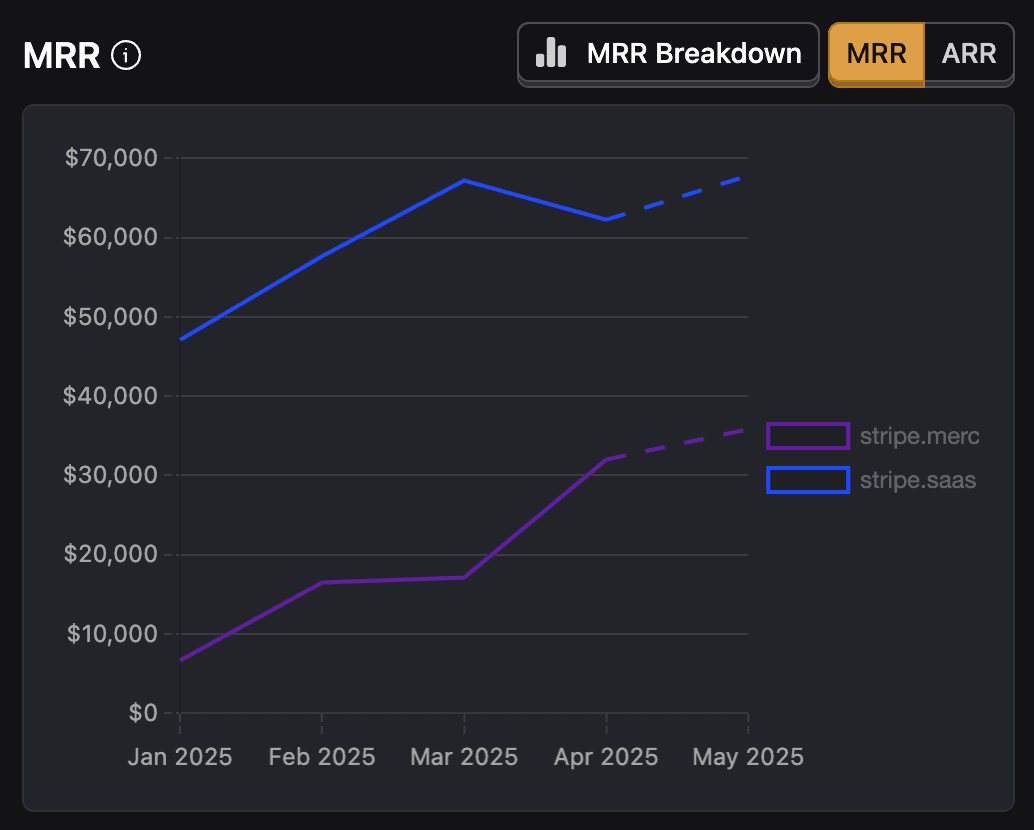
You can toggle the selector to display the Annual Running Rate (ARR) instead.
What's MRR?
MRR stands for Monthly Recurring Revenue. It's a metric that measures how much revenue you're making from customers with active subscriptions.
This is automatically calculated by PostHog based on the revenue data you've sent us. For event sources it'll only be included in case you've configured a revenue event with a subscription property.
When looking at your data per month we report what that amount was on the last day of the month.
What's ARR?
ARR stands for Annual Run Rate, it's your current revenue projected out over 12 months - MRR * 12.
This number does not try and predict what your revenue will be in the future, it assumes you'll keep the exact same customers paying the exact same amount for the next 12 months.
This metric is unlikely to reflect the actual revenue 12 months from now, but it's usually the first number your investors will ask you about.
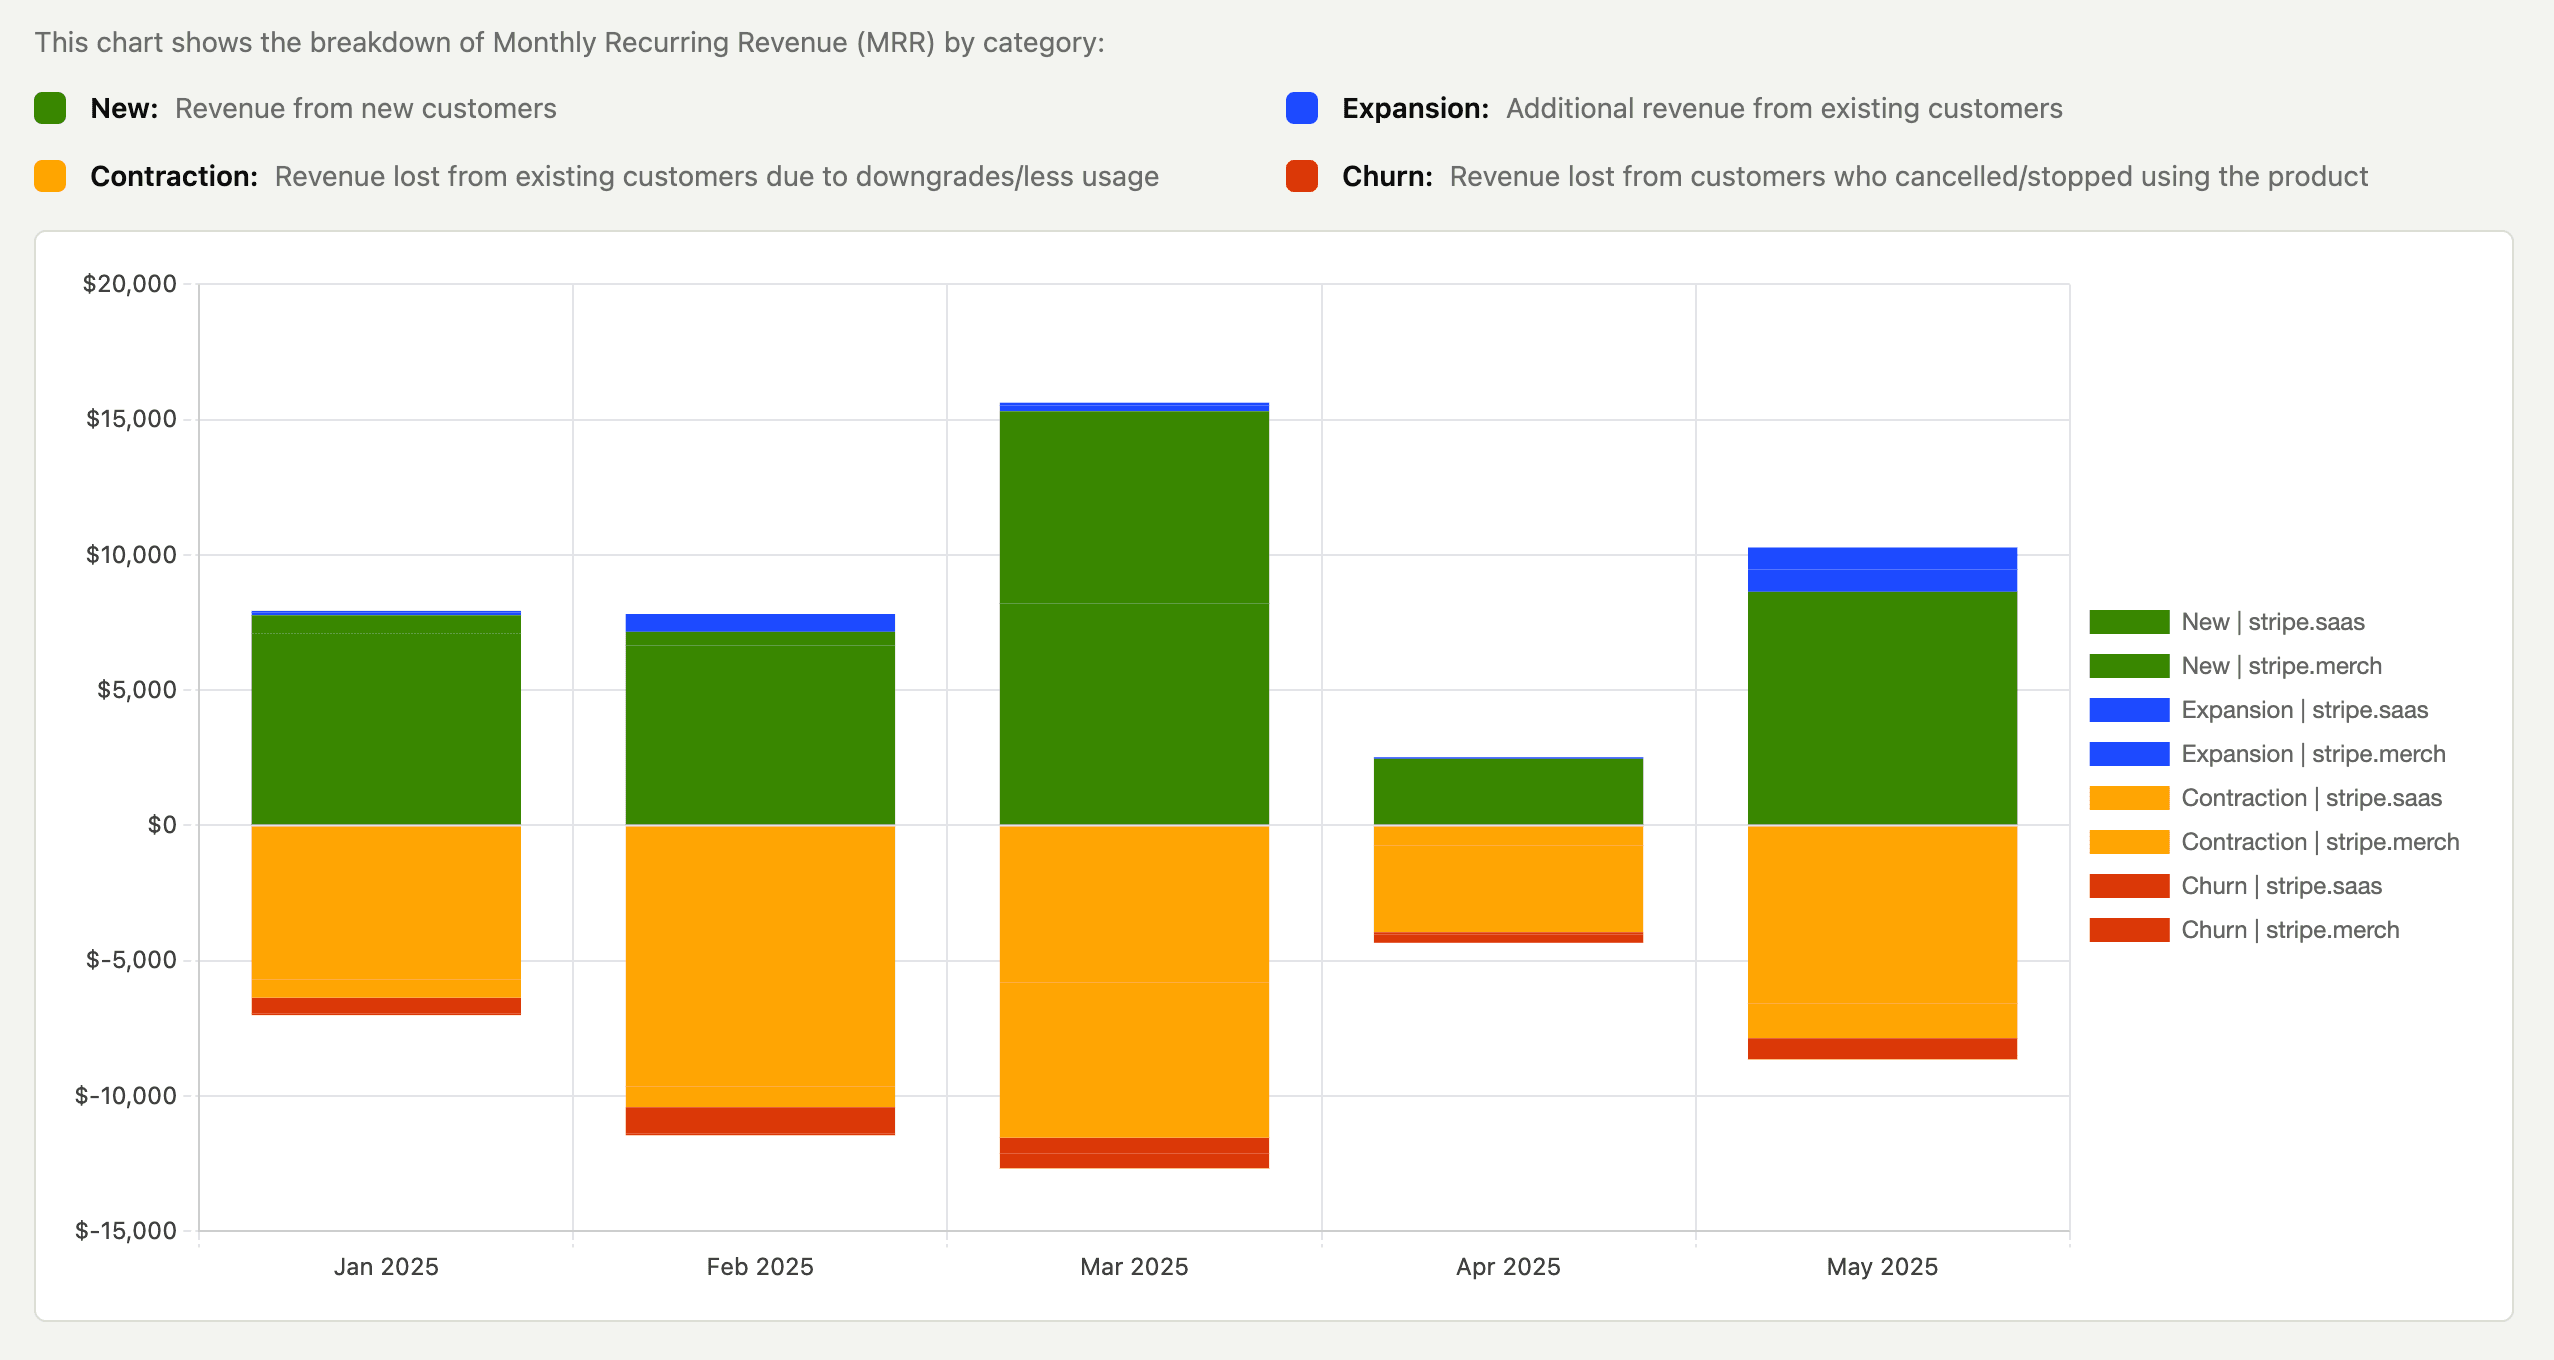
MRR Breakdown
Besides seeing a global overview of your MRR, you can also break it down by the different components that make up your MRR:
| Component | Description |
|---|---|
| New MRR | MRR from new customers |
| Expansion | MRR from existing customers who have paid more in the current subscription period than the previous one |
| Contraction | MRR from existing customers who have paid less in the current subscription period than the previous one |
| Churn | MRR from existing customers who cancel their subscription OR whose charge was 0 in the current subscription period |
This is calculated day by day. If you're looking at a timeframe where we display monthly data then we'll display the aggregated data for the whole month.

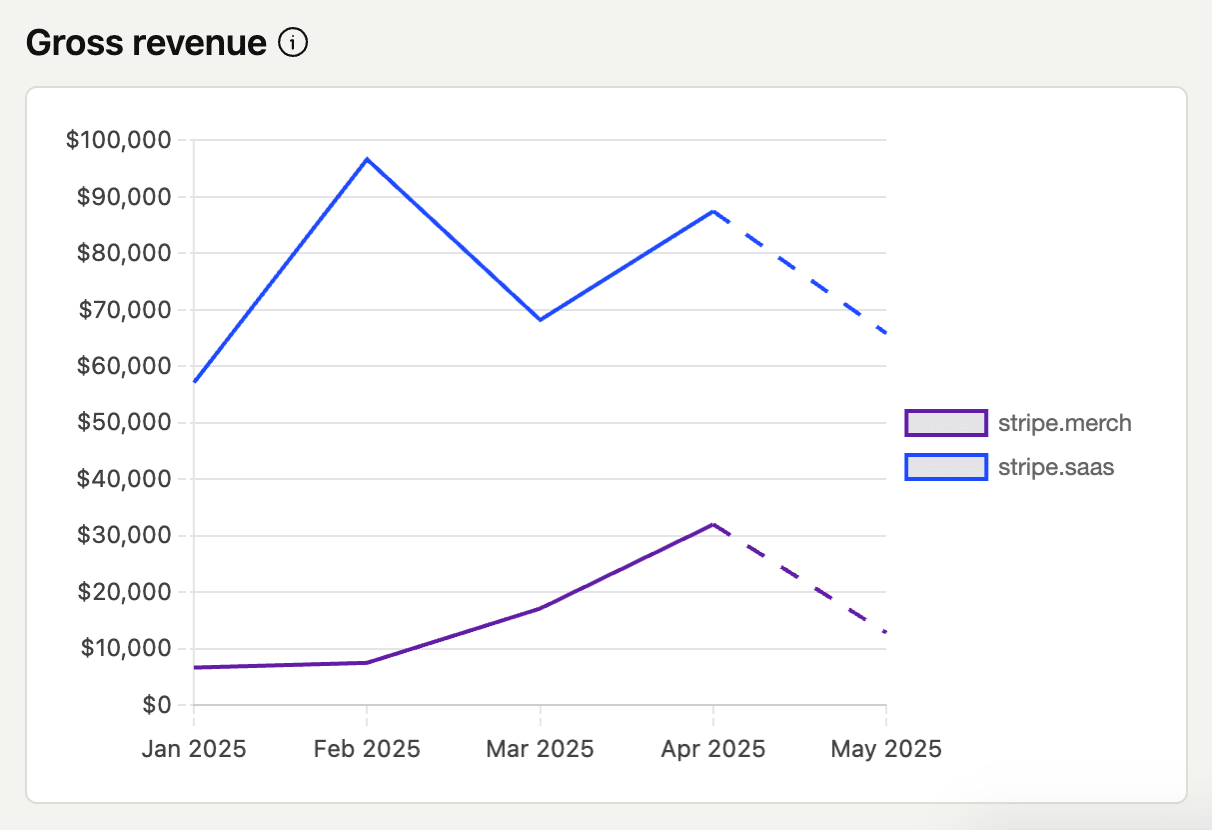
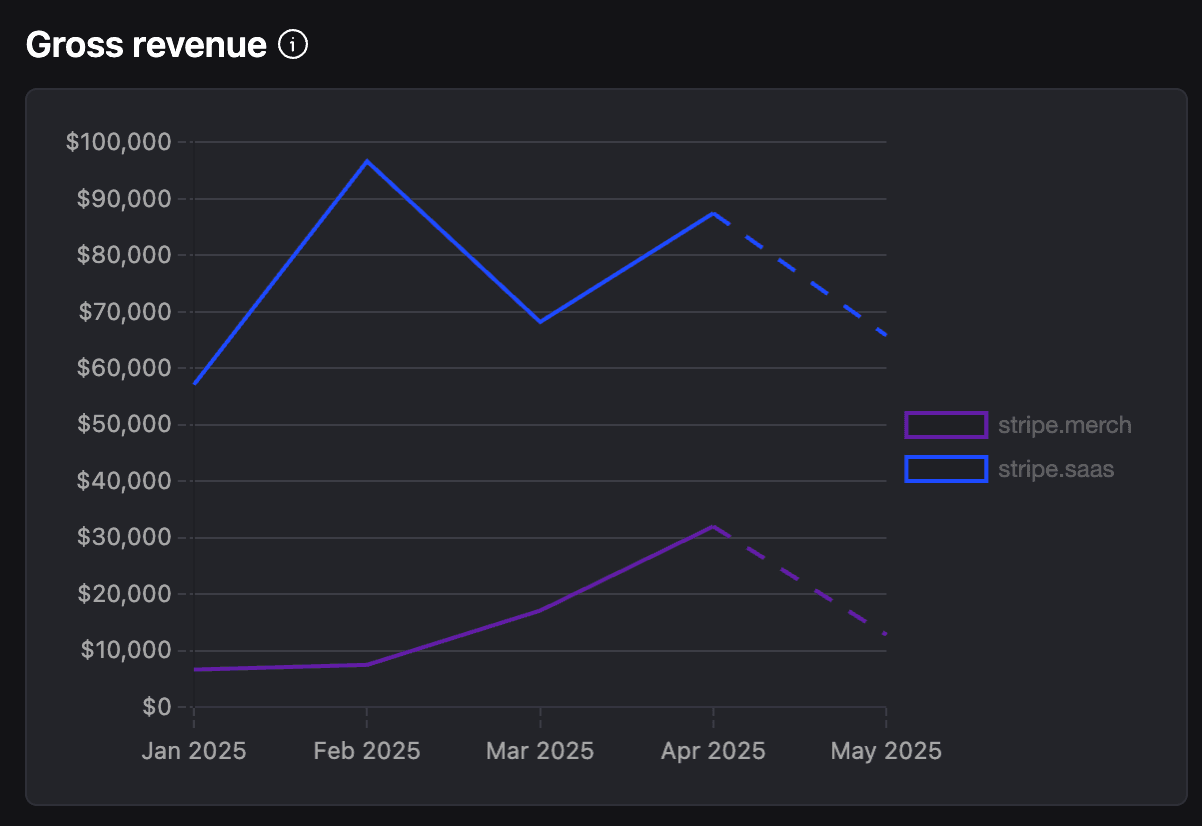
Gross Revenue
This is all the revenue you made regardless of whether it's a recurring charge or not, including one-time purchases. It will also include negative charges in case you've refunded a customer.
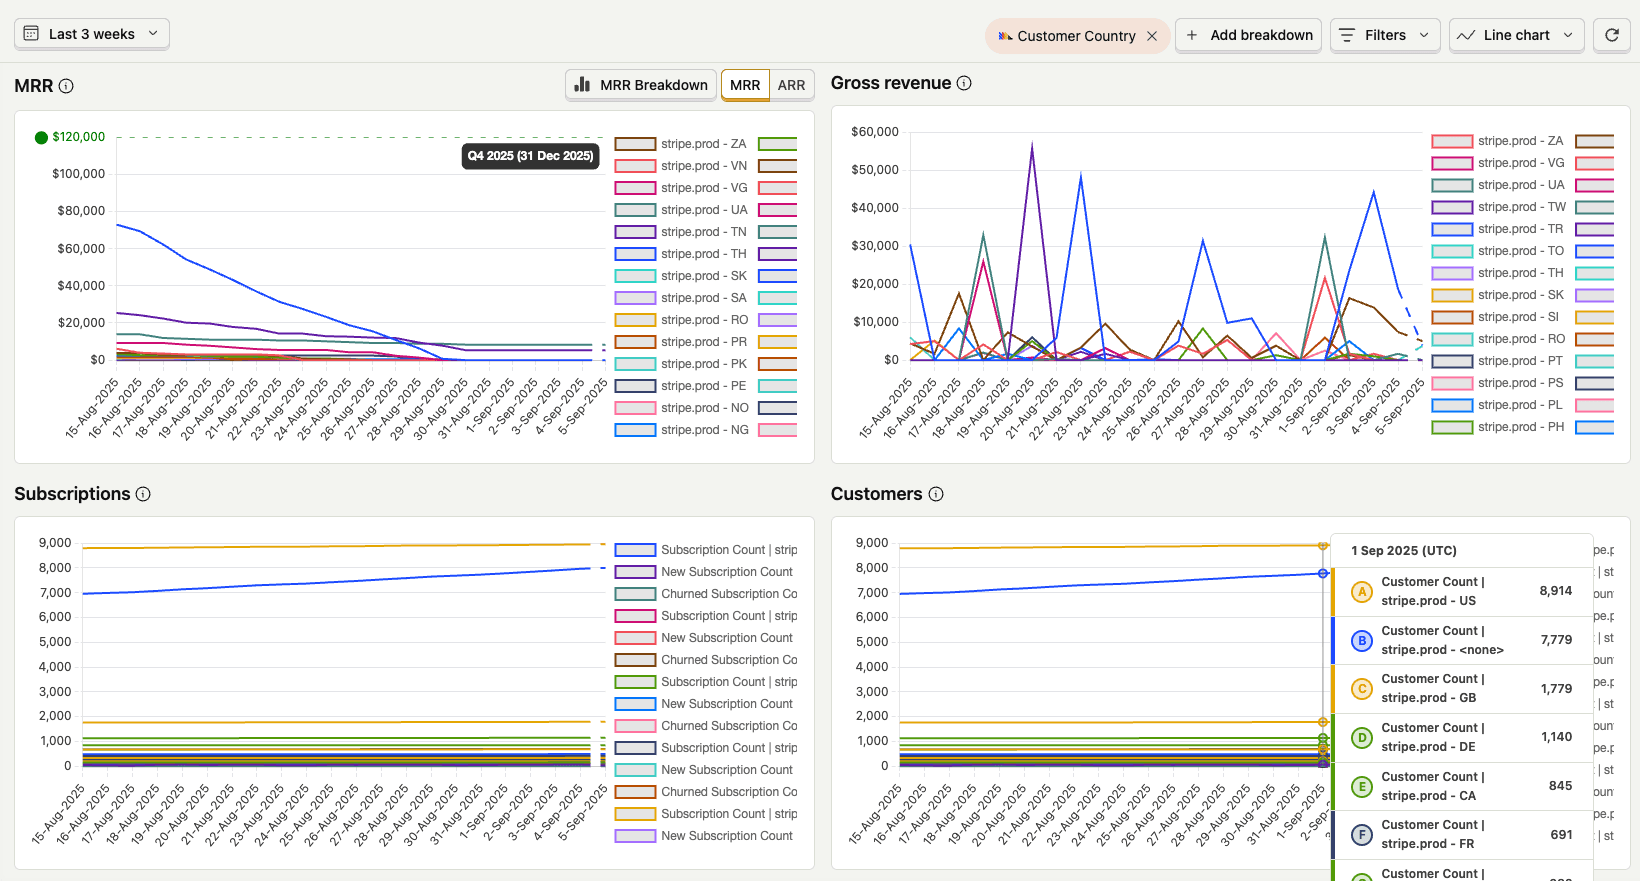
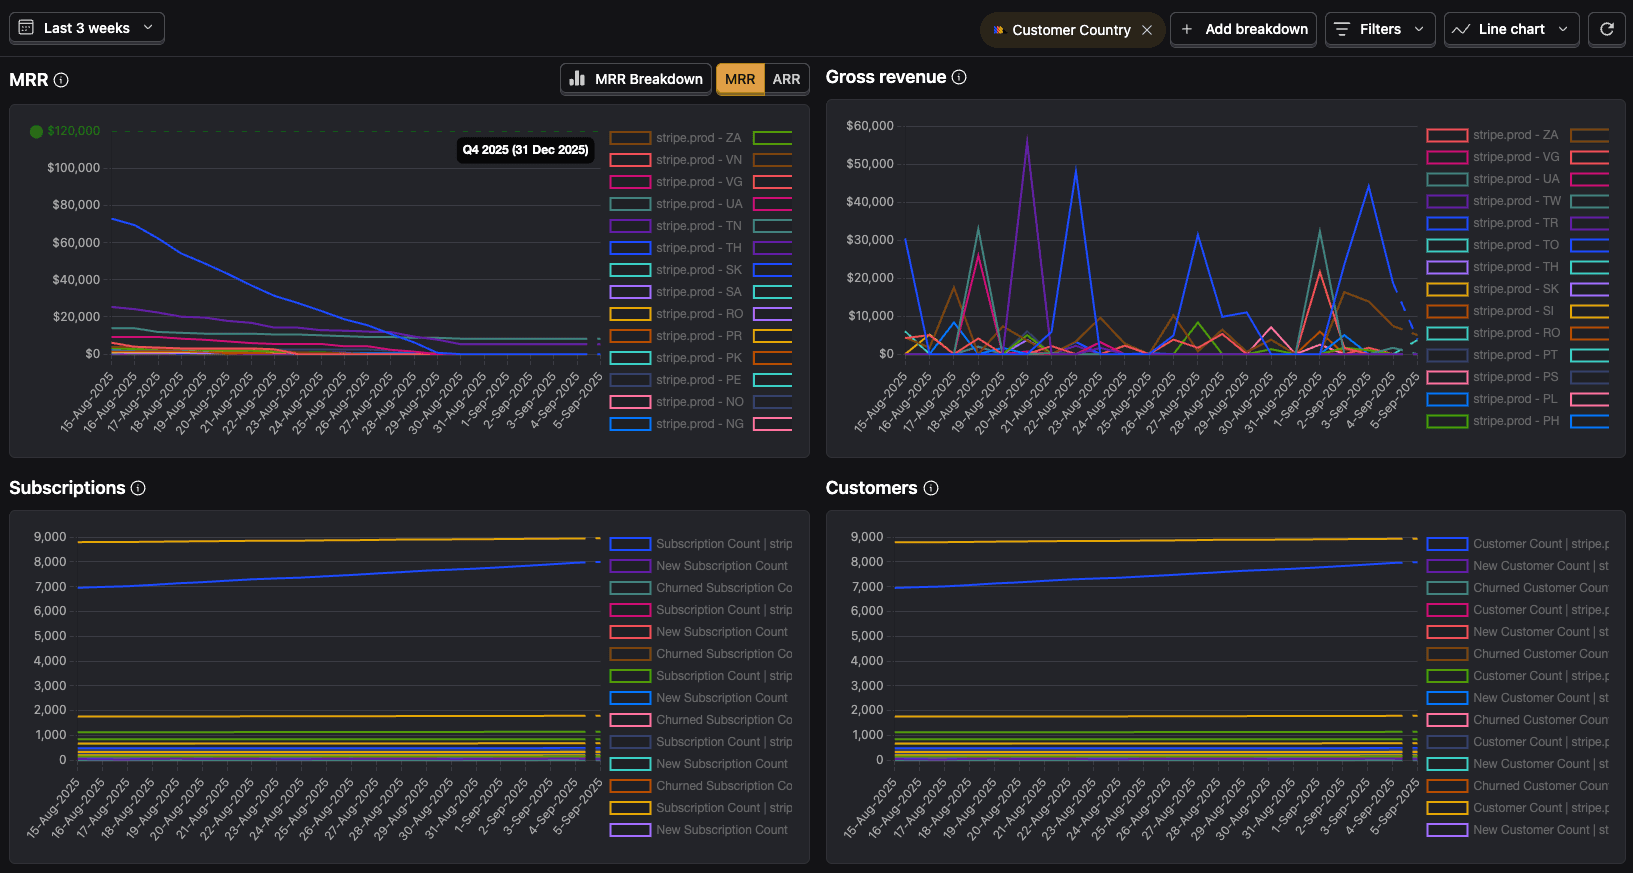
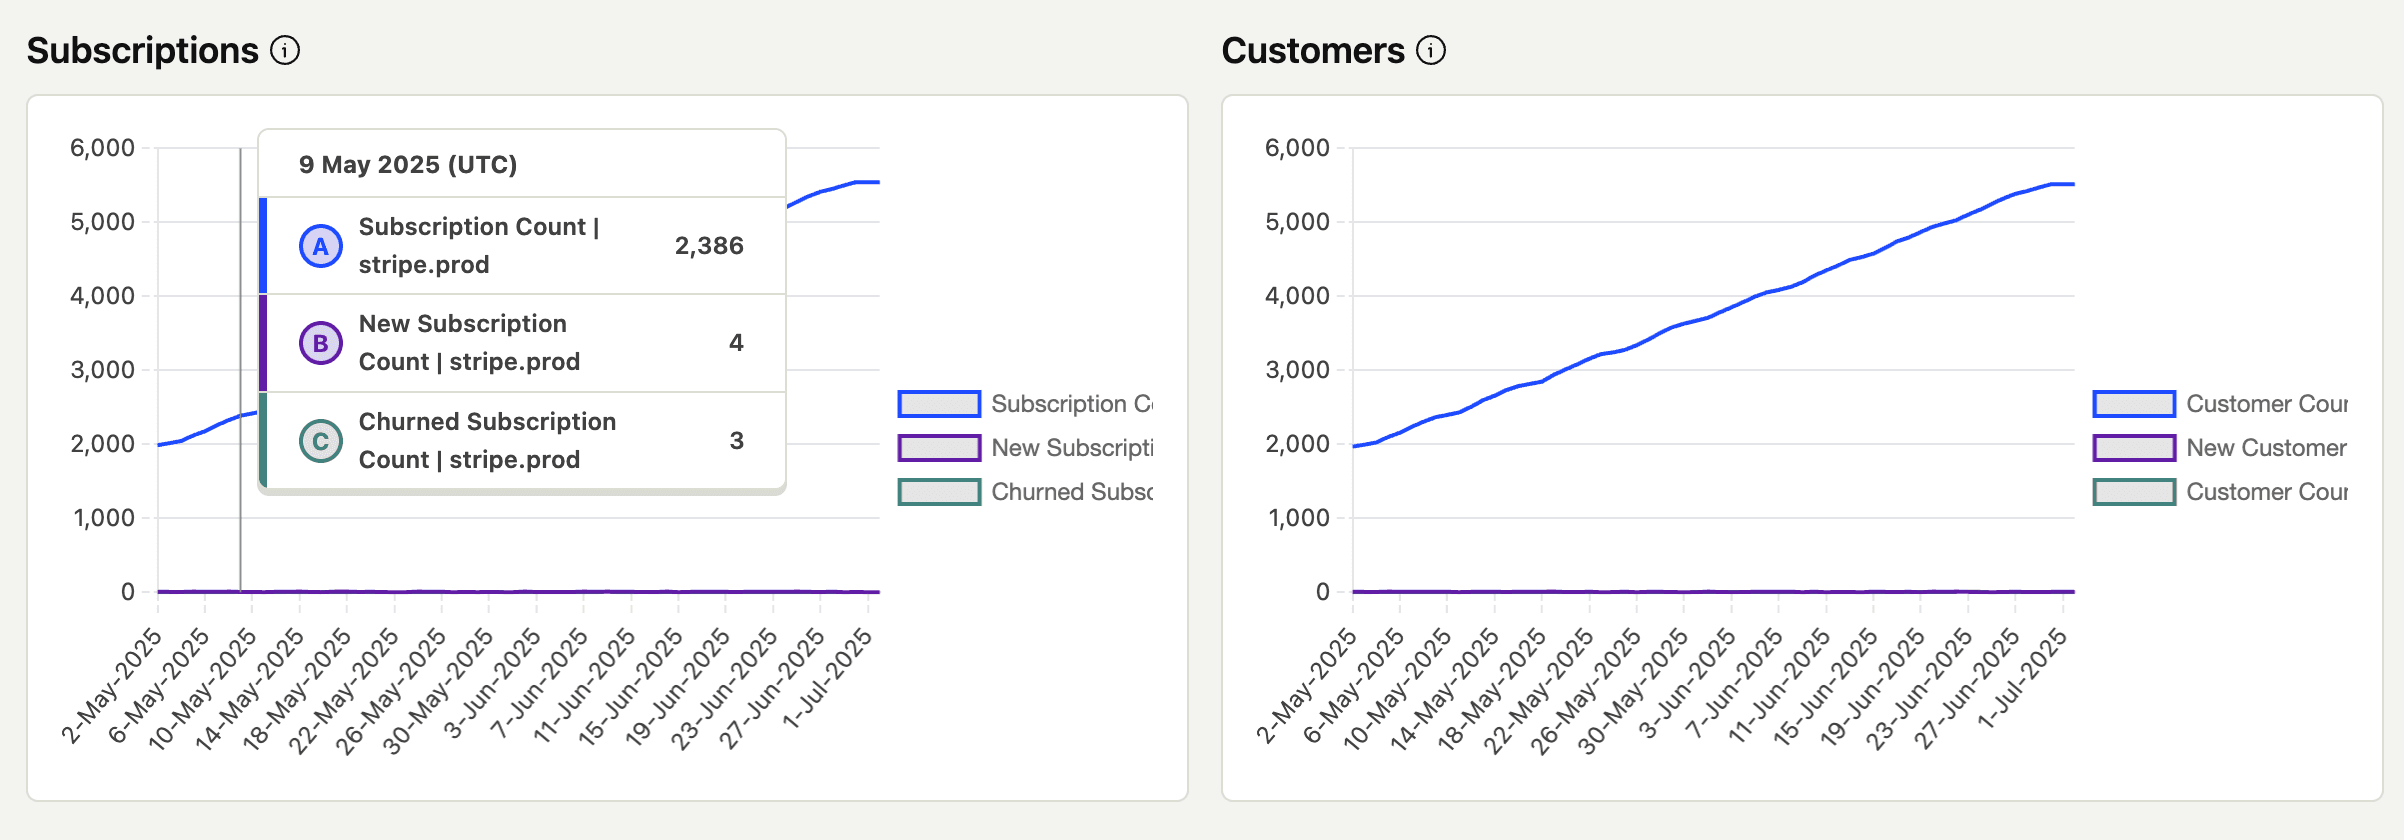
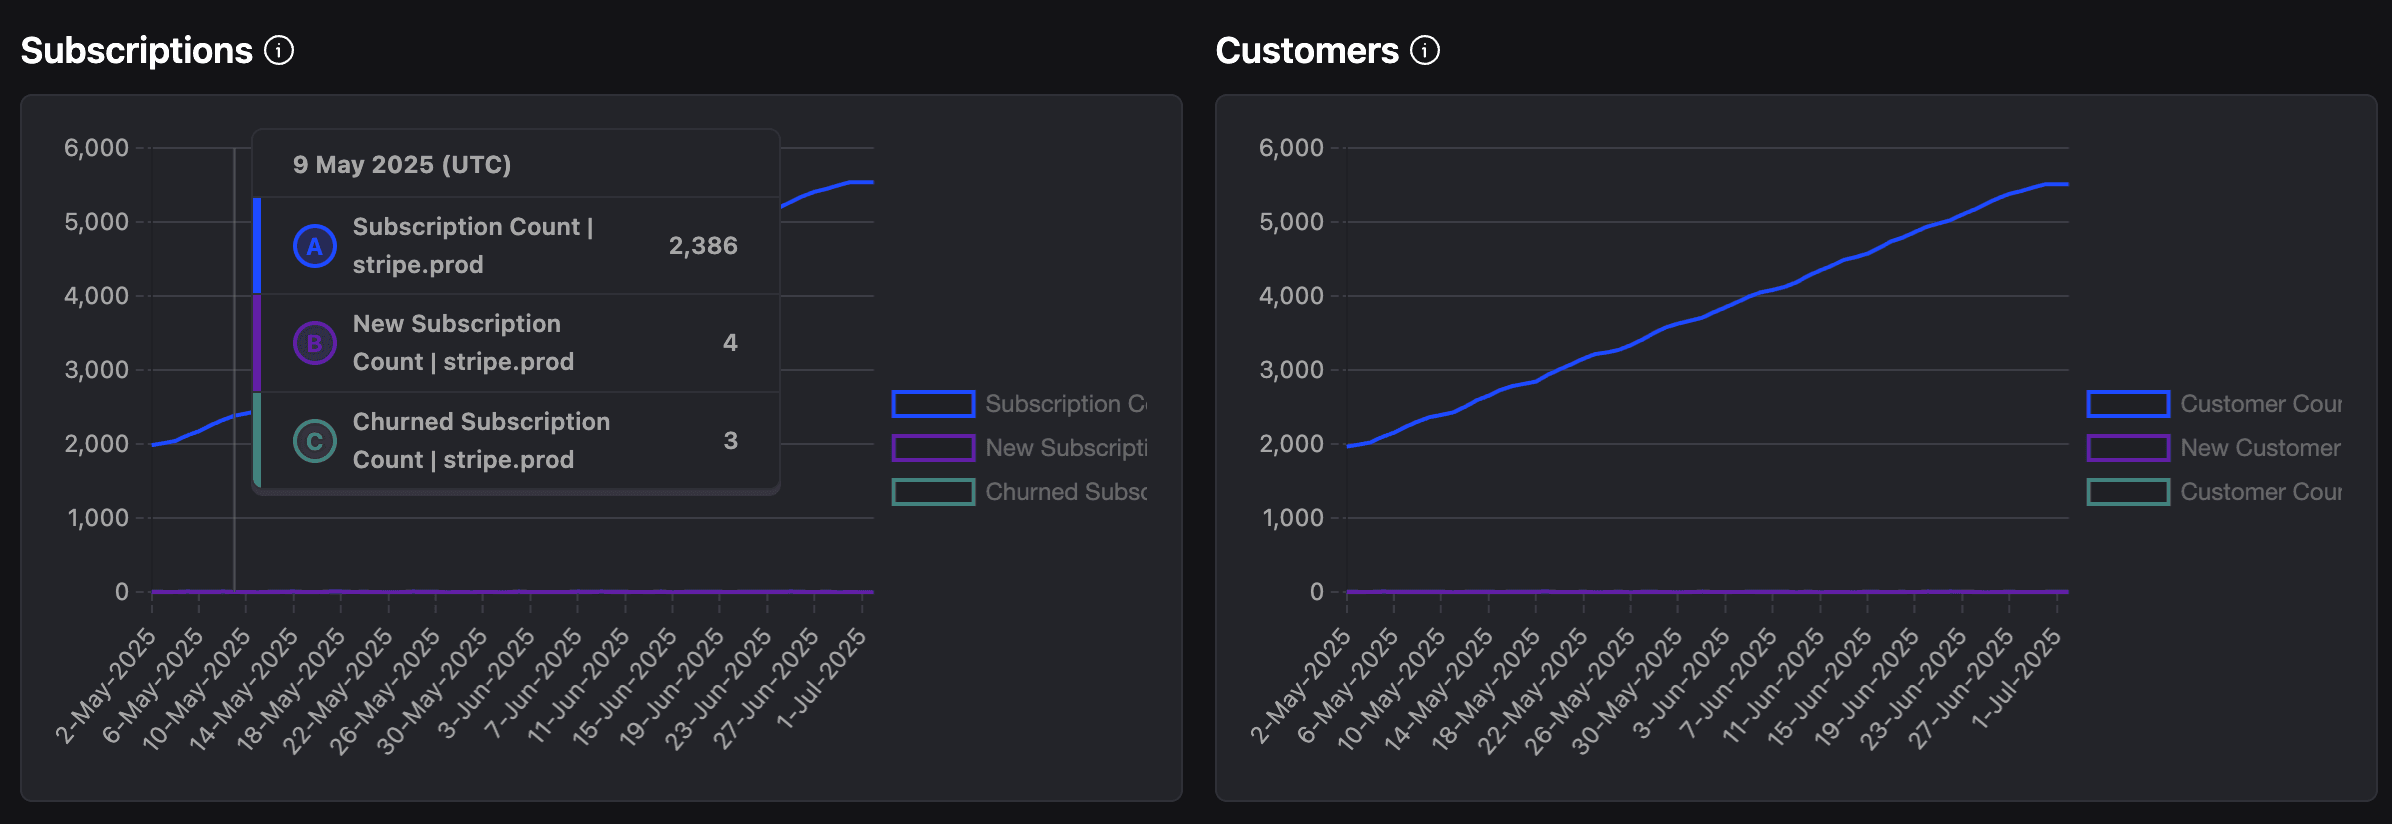
Subscriptions and customers
These two charts help you understand how many active subscriptions and customers you have. These will include all the subscriptions and customers you have, regardless of whether they're paying or not.
We'll also include a count of how many customers/subscriptions you're gaining (new customers) or losing (churned customers) on each period.
These charts will only have meaningful information in case you've configured a subscription property in your revenue data source.
This is automatically calculated by PostHog based on the revenue data you've sent us. For event sources it'll only be included in case you've configured a revenue event with a subscription property.
We'll use the number of churned customers to calculate your churn rate # churned_customers / # total customers. This will then be used to calculate your LTV.
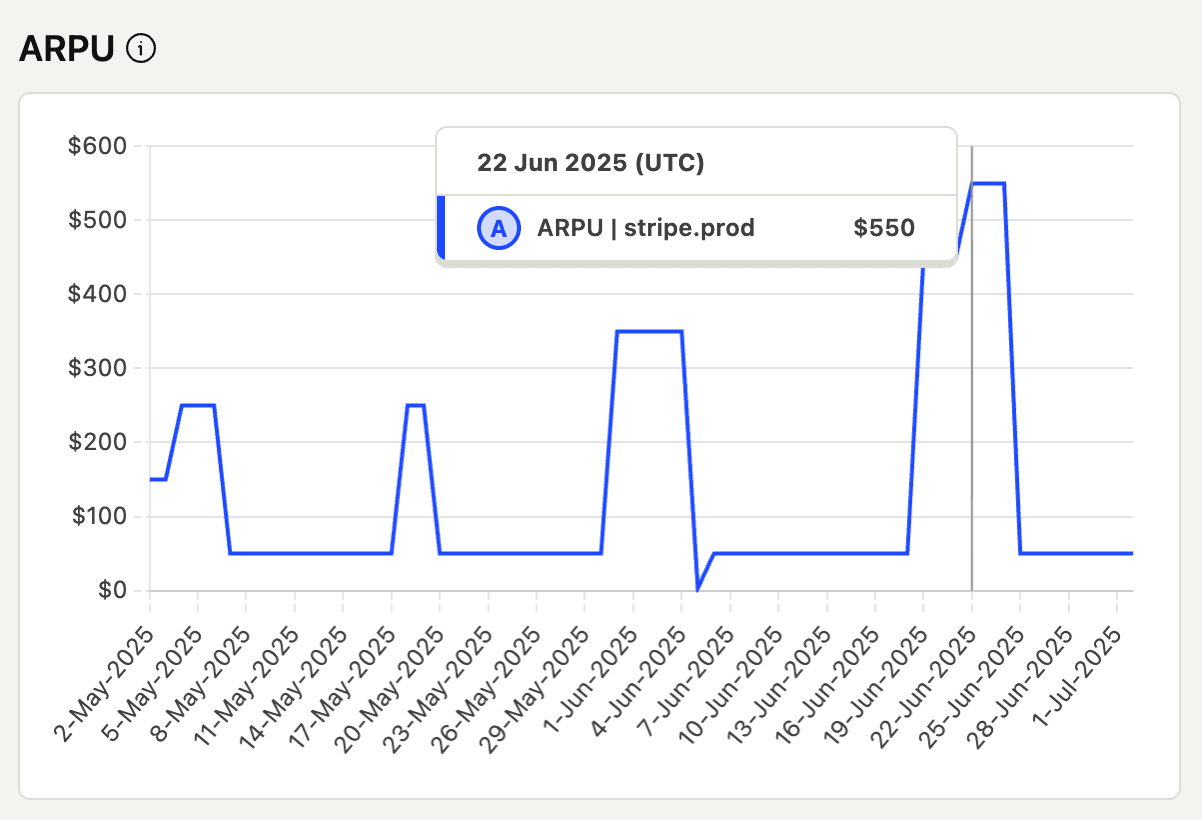
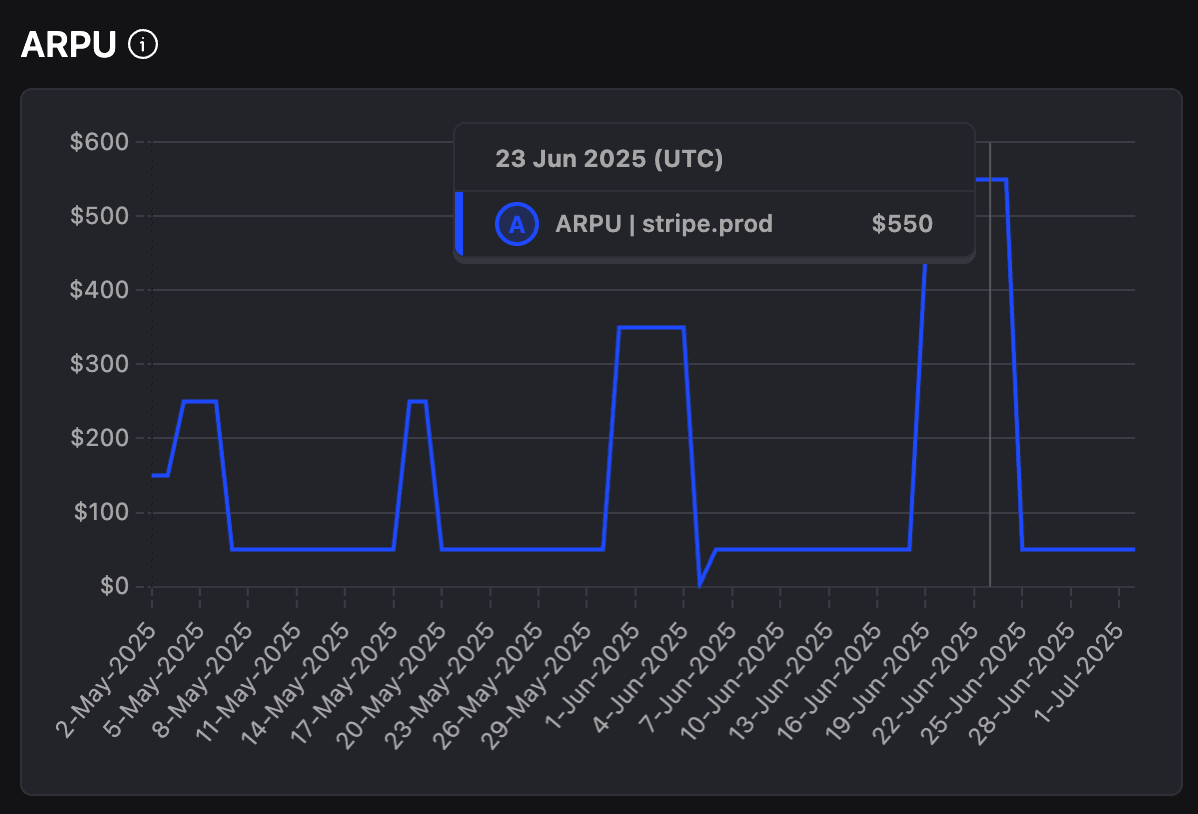
ARPU
Average Revenue Per User (APRU) is a measure of how much revenue you're making from each user on average during that period. It's not restricted to subscriptions only and includes all revenue you're making.
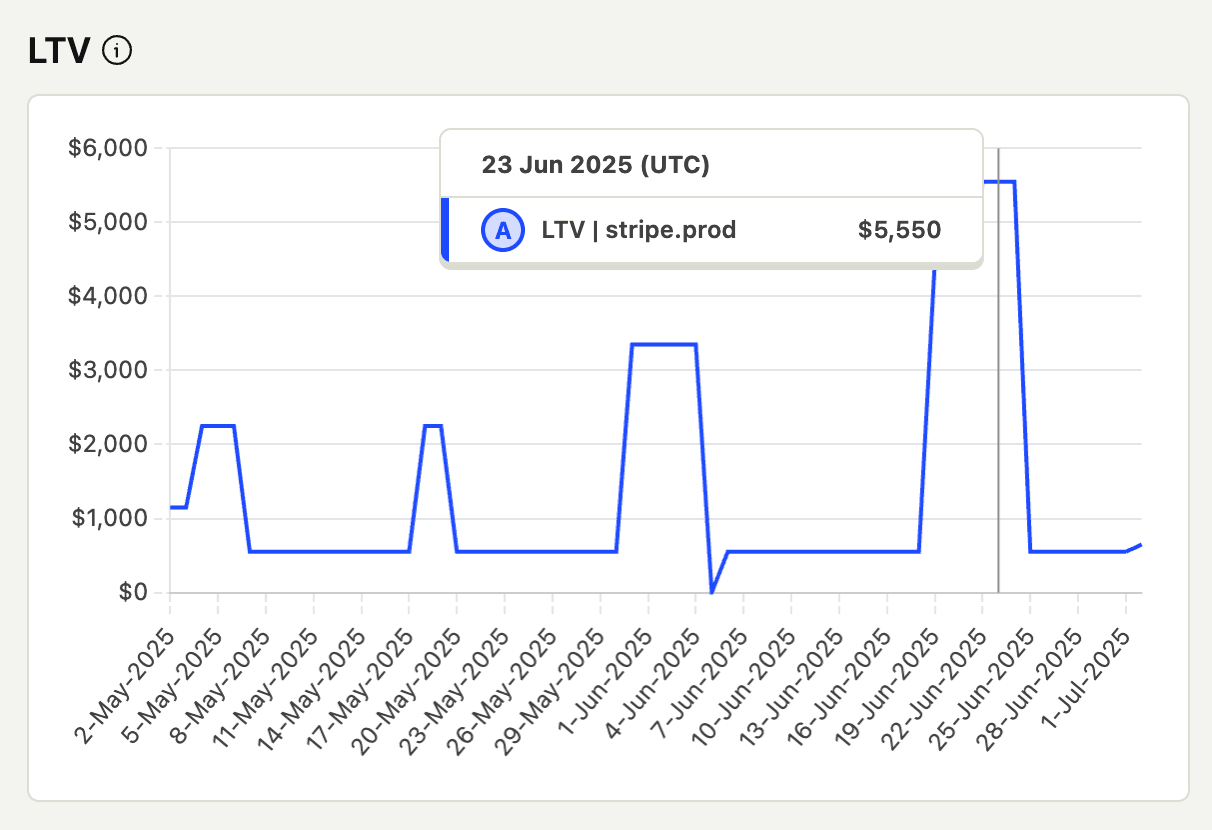
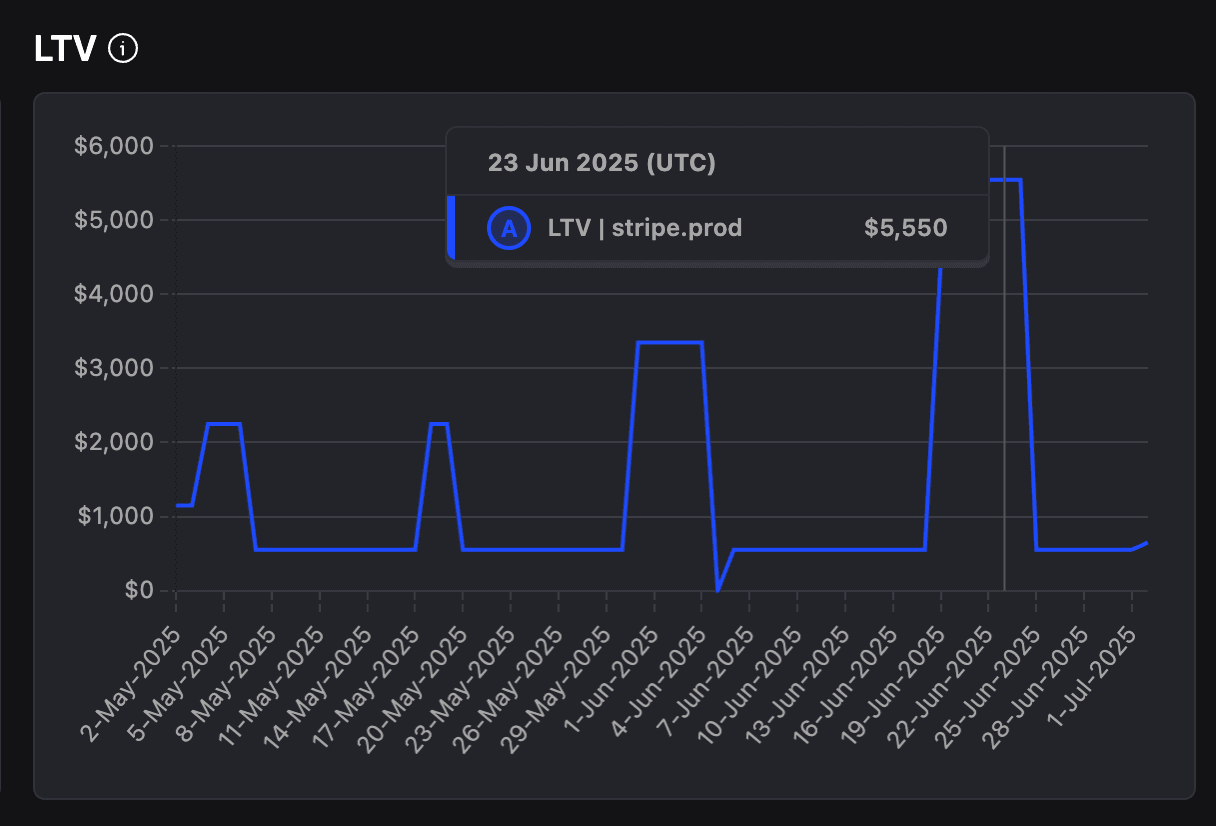
LTV
Lifetime Value (LTV) is a measure of how much you should expect to make in revenue from all your customers through their entire lifetime as a customer. This is calculated as ARPU / churn rate.
If you don't have any churn rate we'll not display any datapoints. If you have a churn rate but don't have any revenue then we'll display 0.
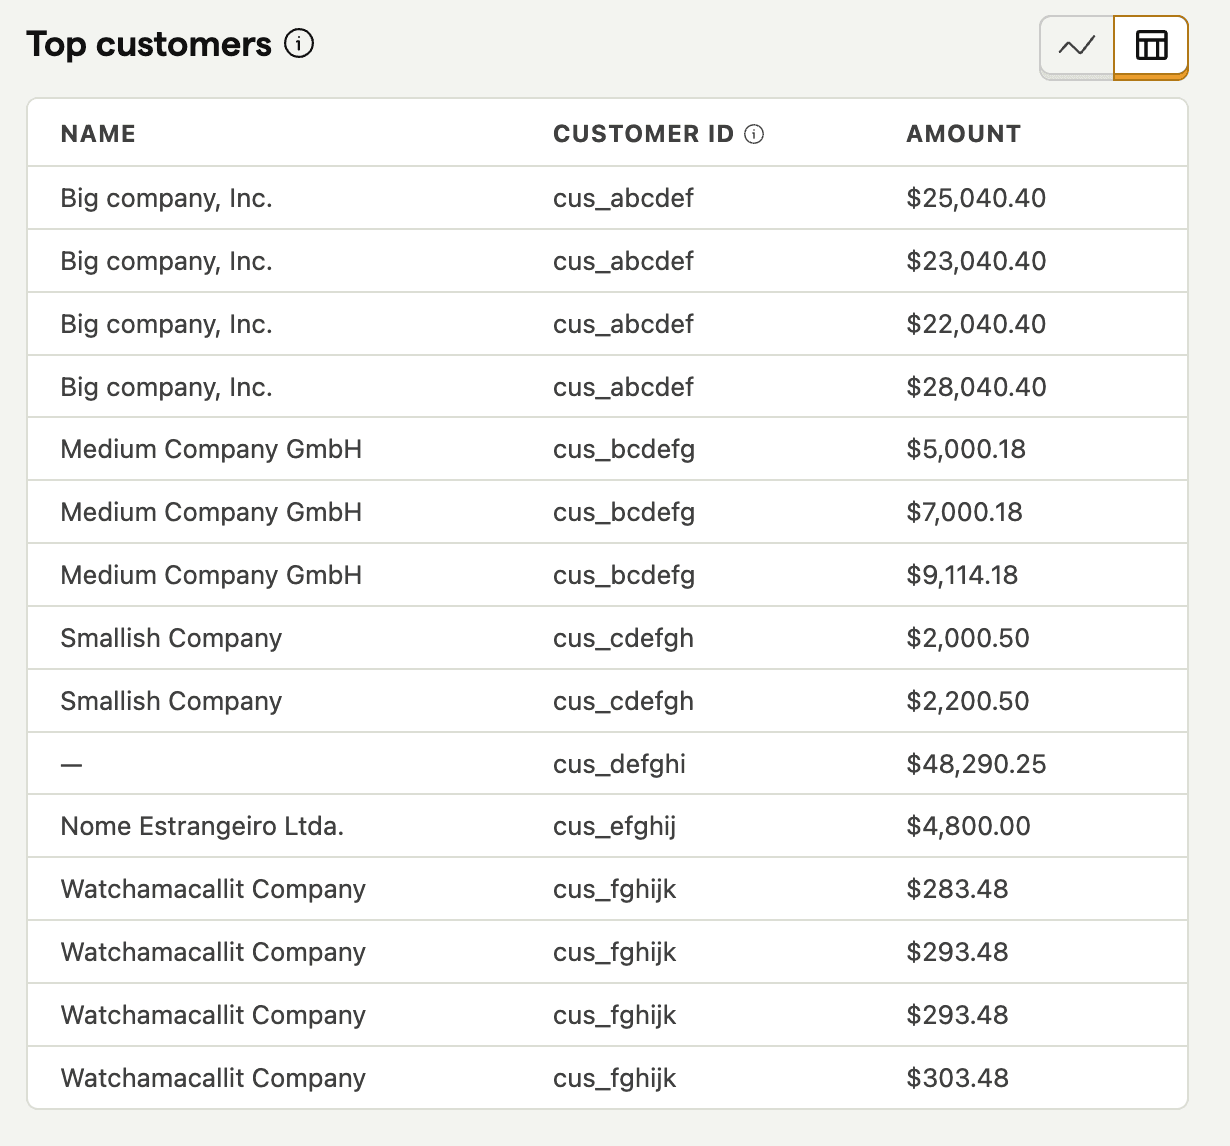
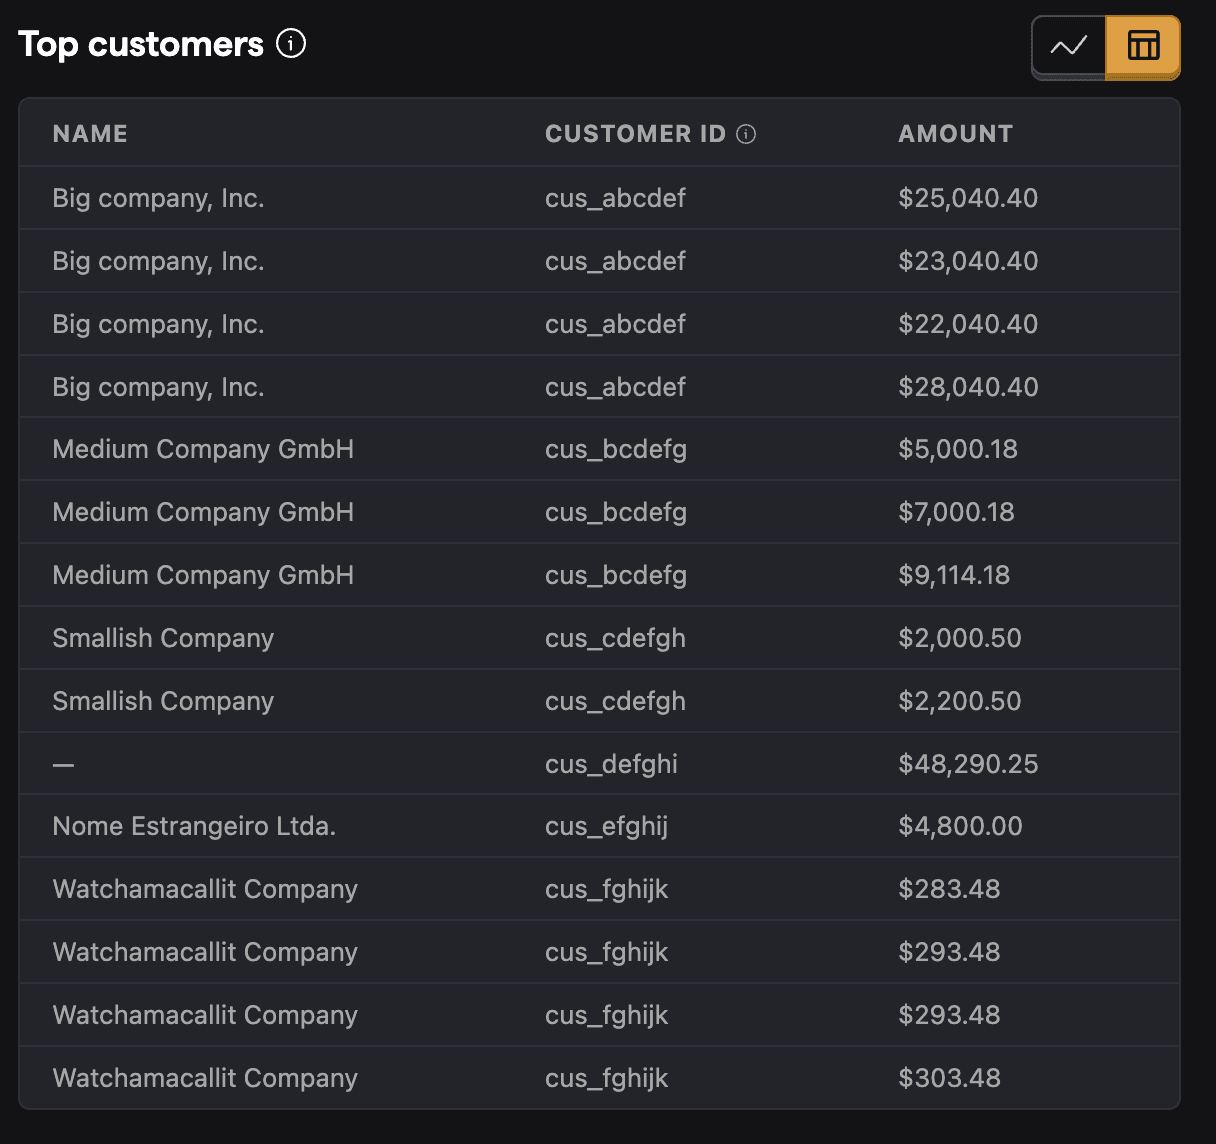
Top customers
The last chart identifies your top customers and how much revenue they're generating for you. This will use deferred revenue to calculate the revenue for each customer which means that if someone's paid a lump sum for a multi-month subscription you'll see it properly split in months if you've set the charge period accordingly in your data source.
For data warehouse sources we'll use the data source identifier. We'll only be able to display the name if you've connected your source to persons or groups table in the revenue analytics settings.
Revenue goals
You can configure revenue goals to track your revenue targets in the revenue analytics settings.
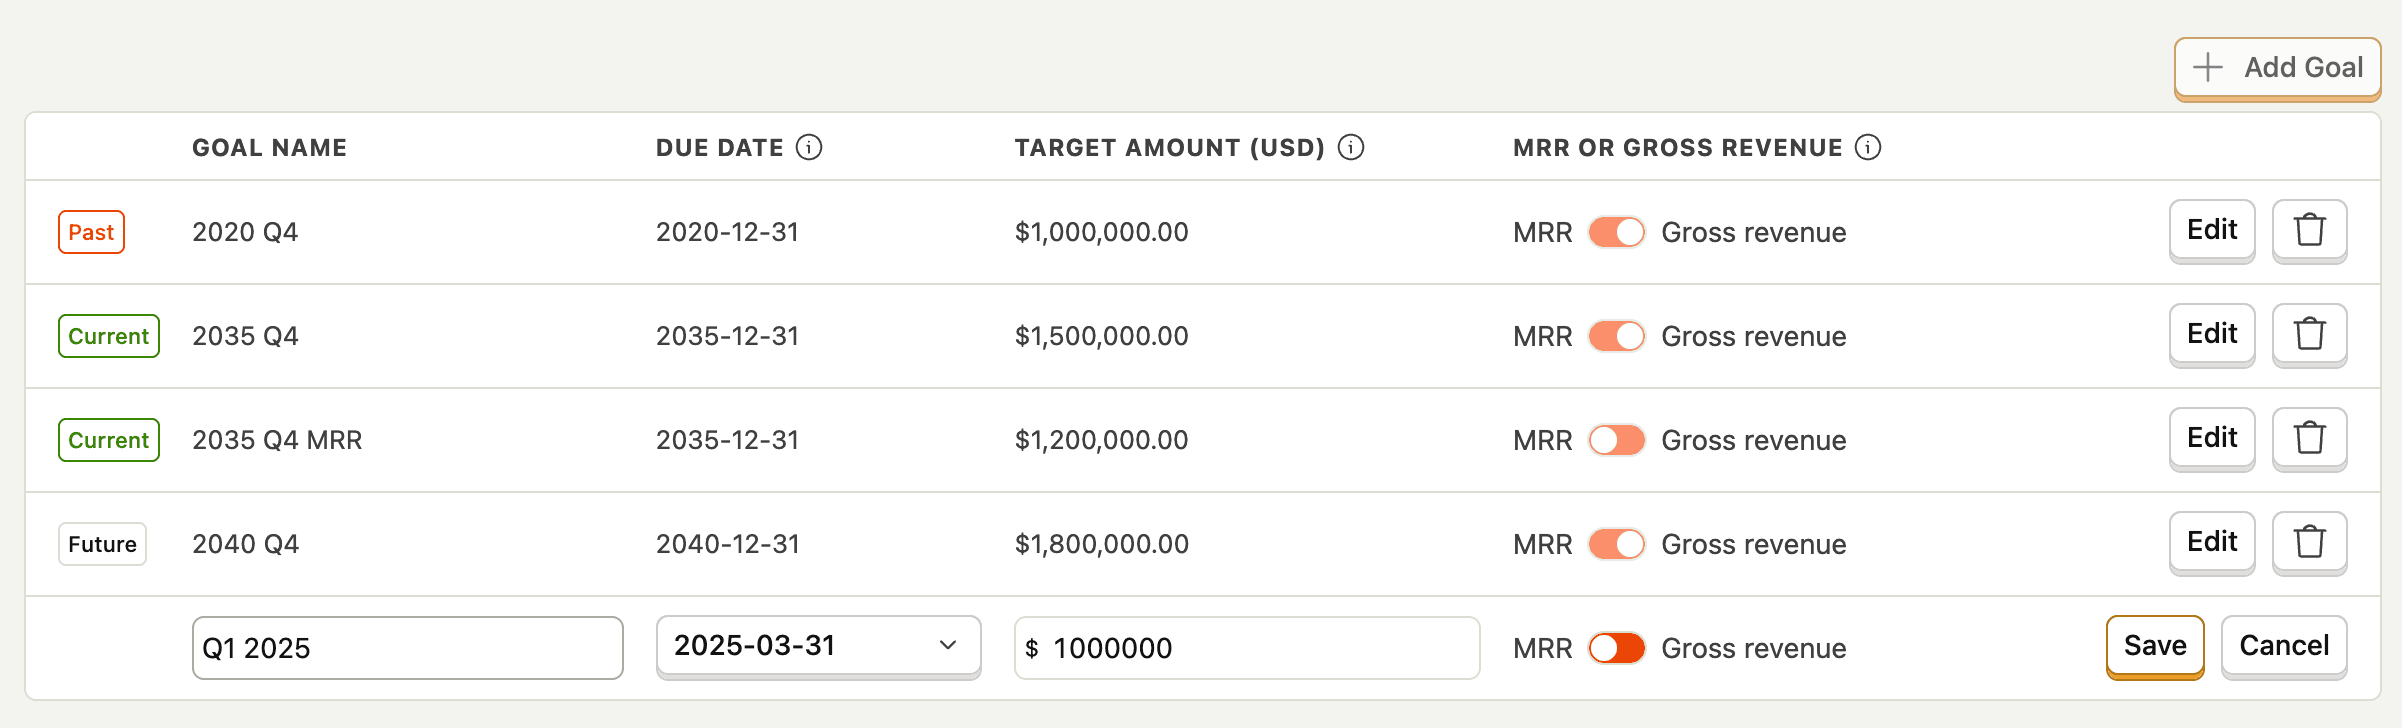
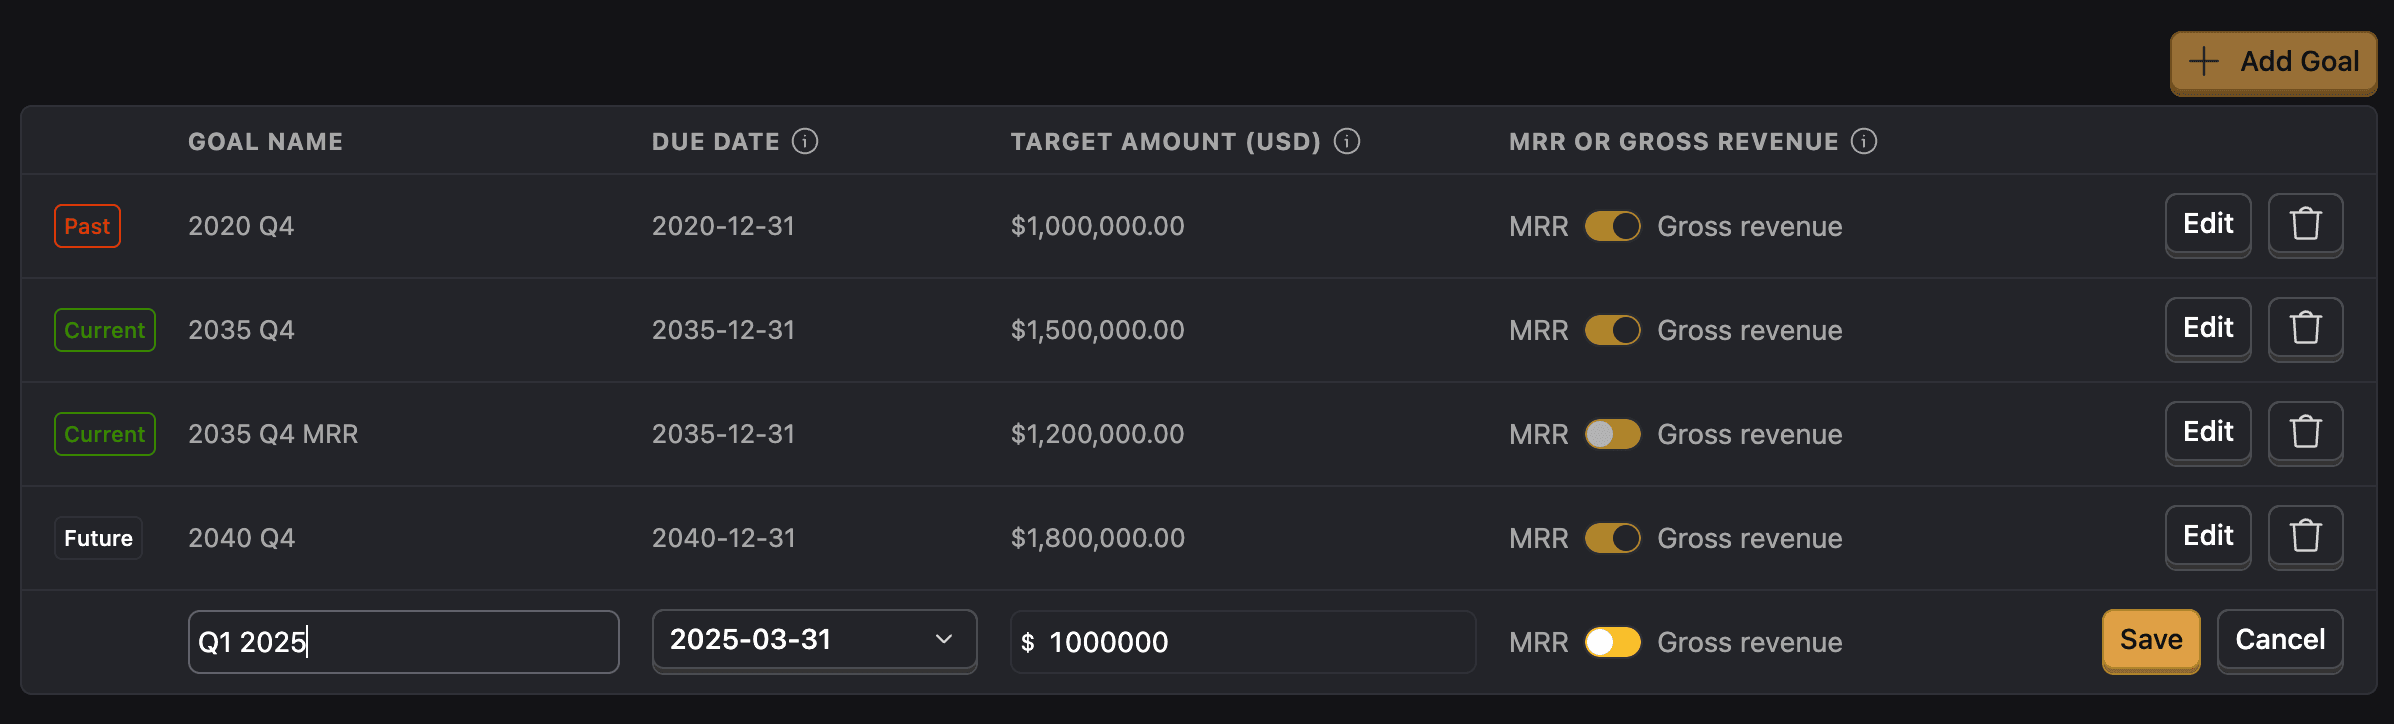
These goals will then be displayed in the revenue analytics dashboard on the MRR/ARR or gross revenue charts – you get to decide where they show up.
We'll only display goals that are within the selected time range OR if they're past but you haven't achieved them yet.
Using revenue data in product analytics
You can use your revenue data for deeper product analytics insights beyond the revenue analytics dashboard, too. This allows you to:
- Create custom revenue funnels
- Analyze user journeys that lead to purchases
- Segment users by revenue contribution
When working with revenue data in product analytics, you may want to use the convertCurrency function for accurate reporting across different currencies.
We also expose streamlined views of your revenue data. You can find them under the views tab in our SQL Editor.