


Analyzing results
Contents
After your experiment runs and collects data, you'll want to analyze the results to determine if your changes had a statistically significant impact. This guide shows you how to understand and interpret your experiment results in PostHog.
Understanding exposures
The exposures panel shows you how many users have been exposed to each variant of your experiment:
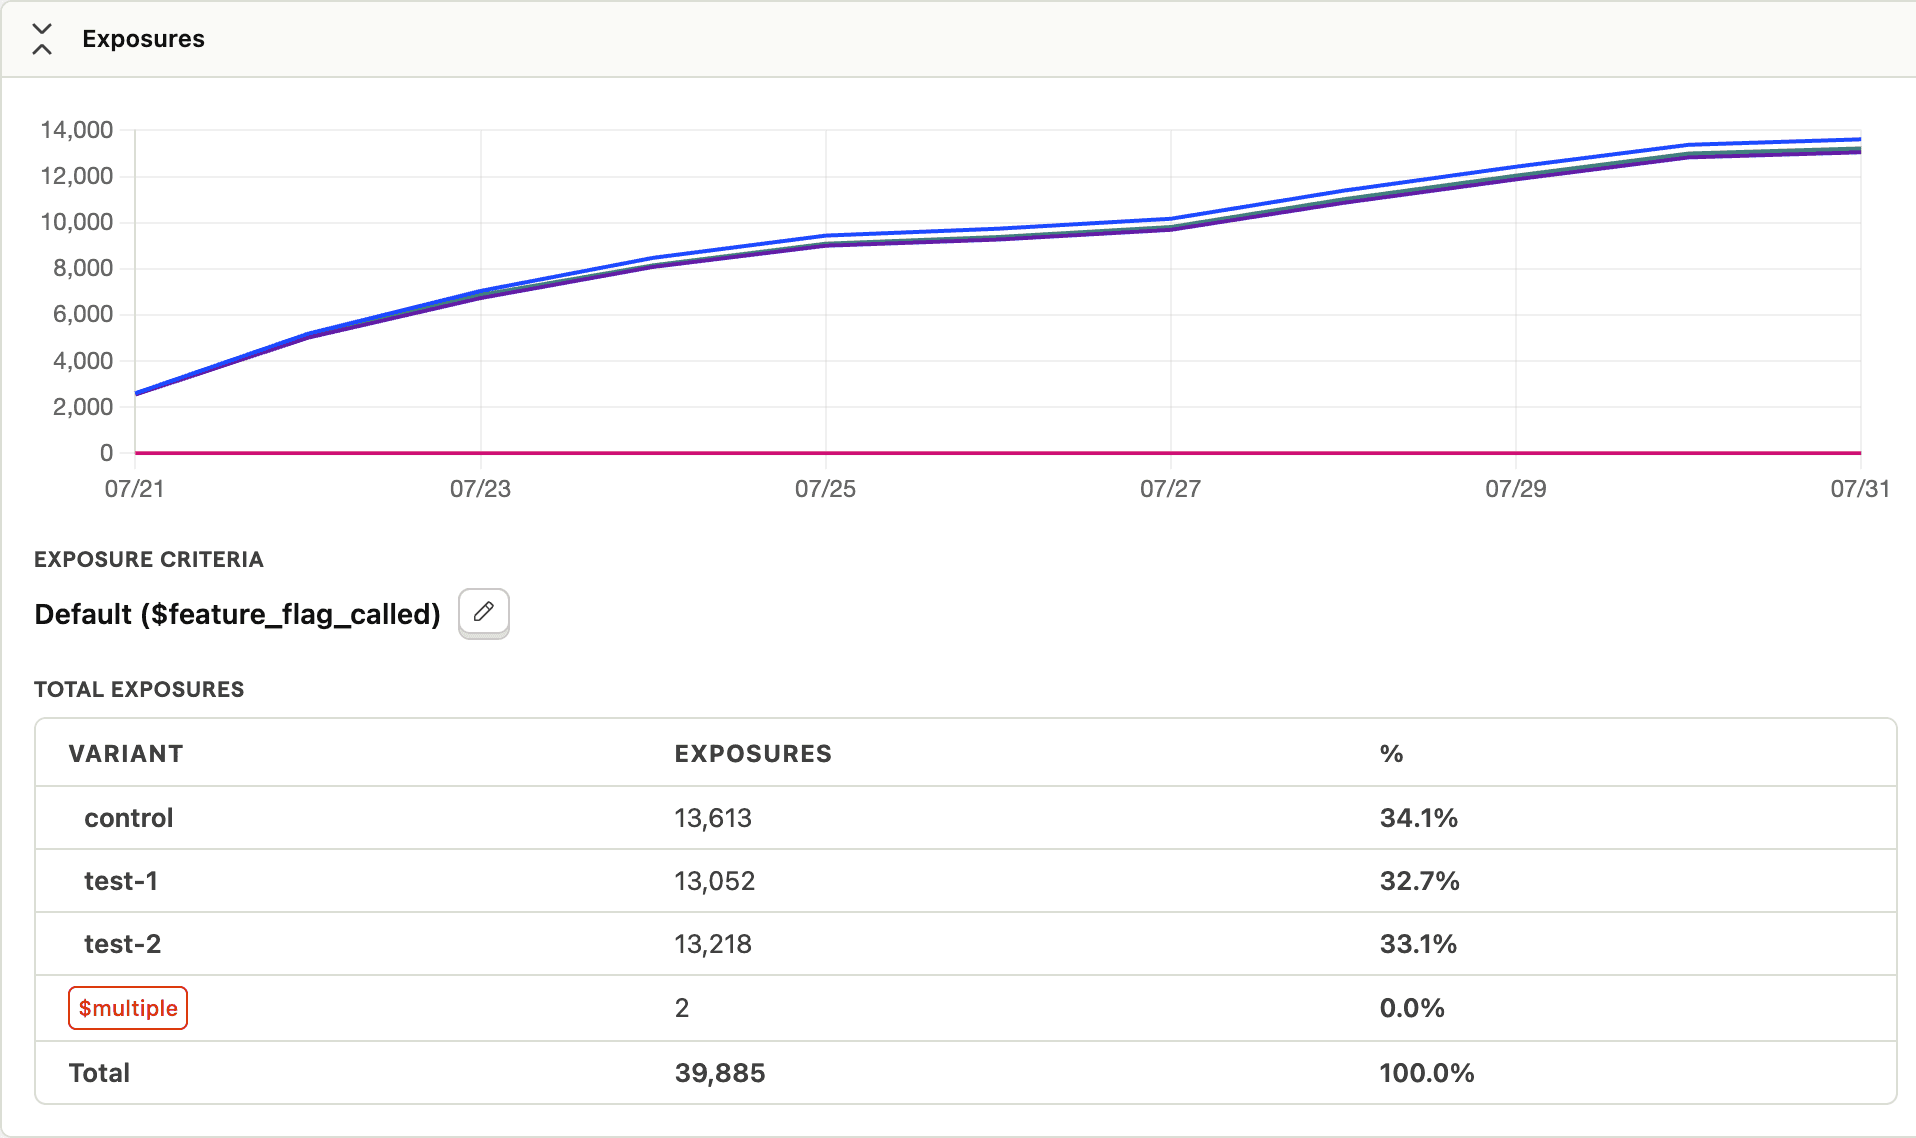
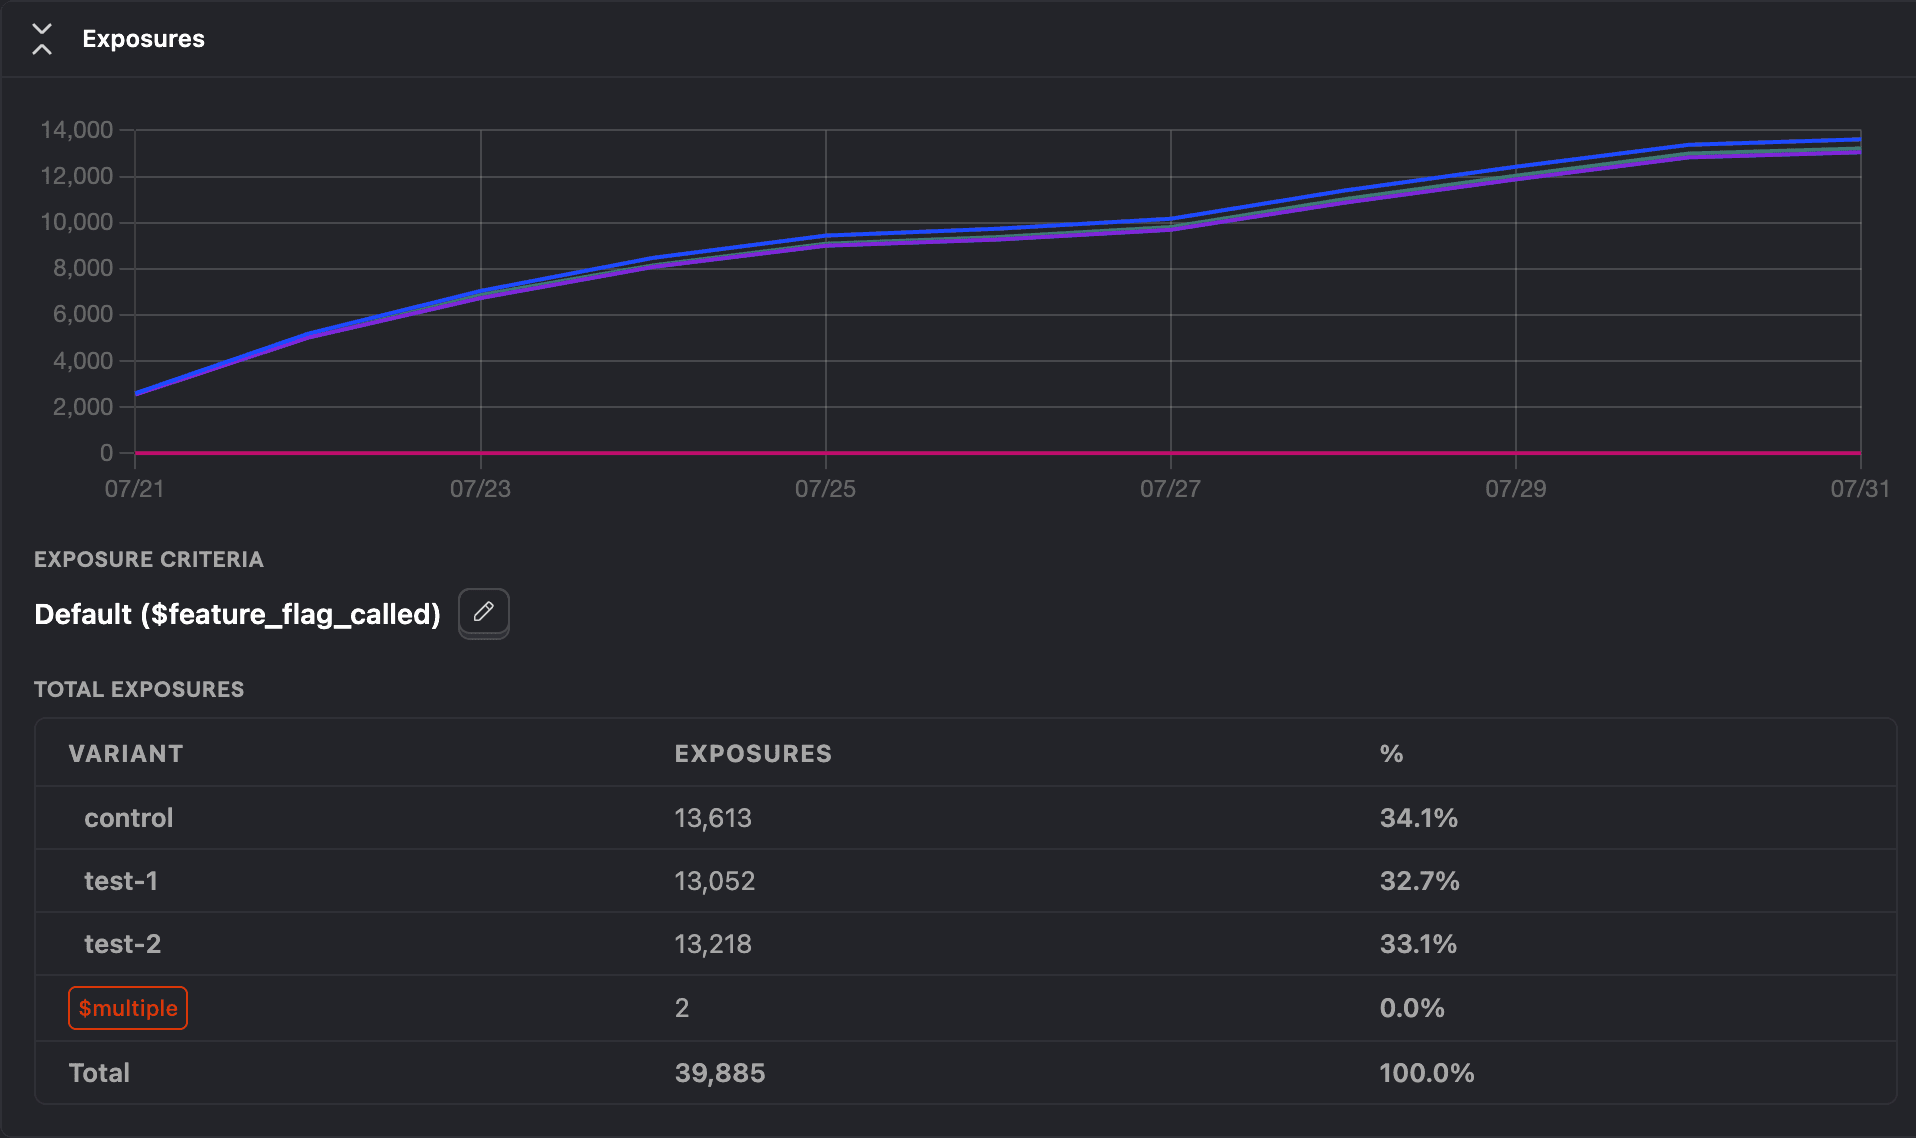
This collapsible panel displays:
- Exposure count: The total number of unique users who have seen each variant
- Percentage distribution: How users are split between variants (typically 50/50 for two variants)
The exposure numbers help you verify that:
- Your experiment is running and users are being assigned to variants
- The split between variants matches your expected allocation
- You have sufficient sample size for meaningful results
Metric results and determining significance
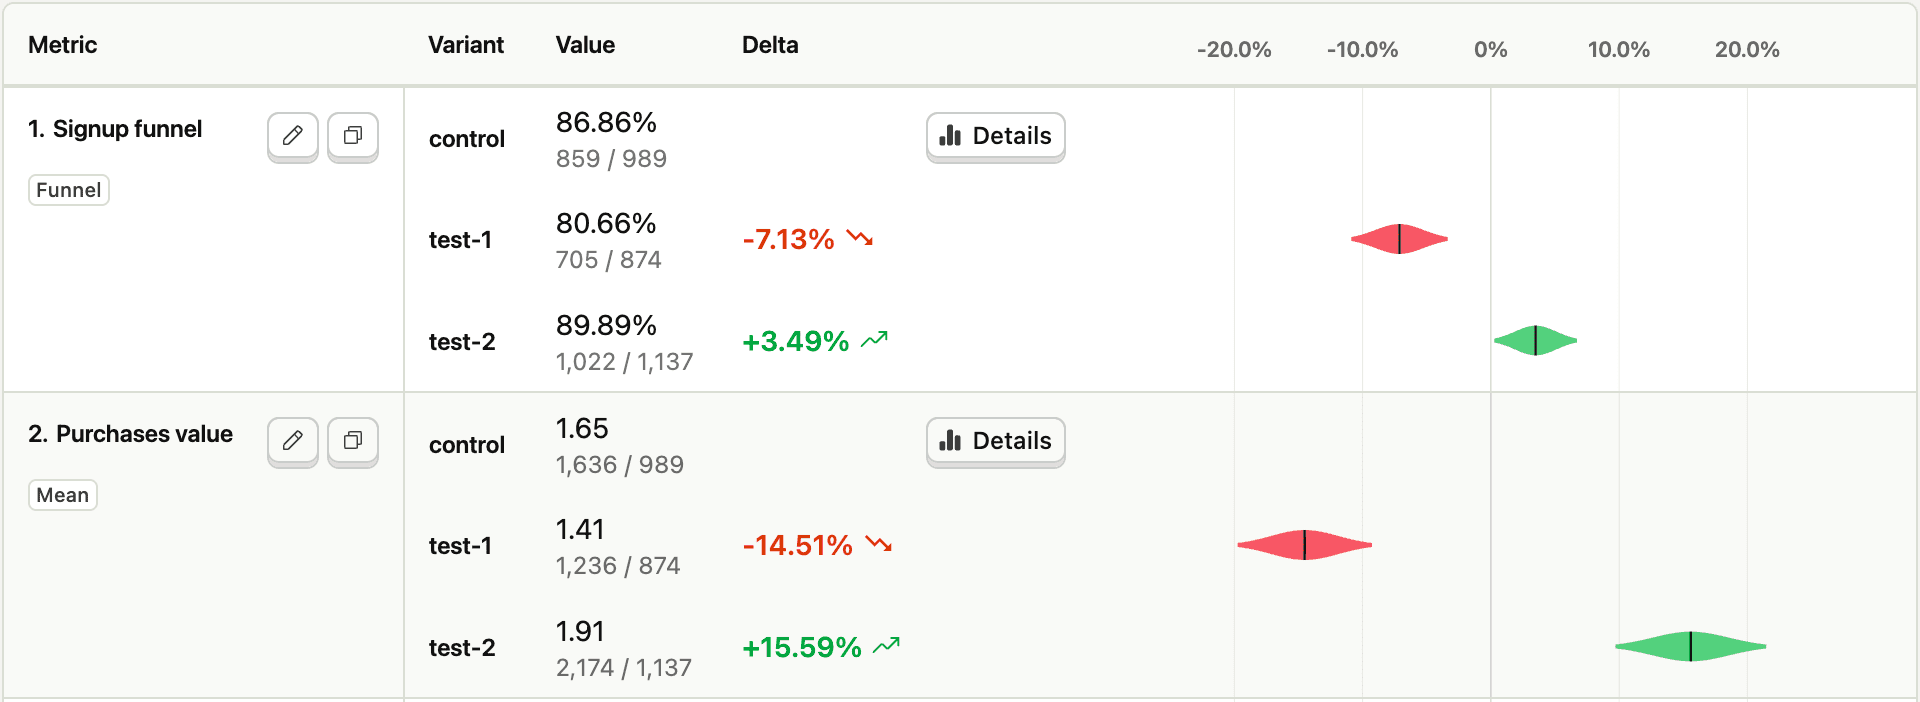
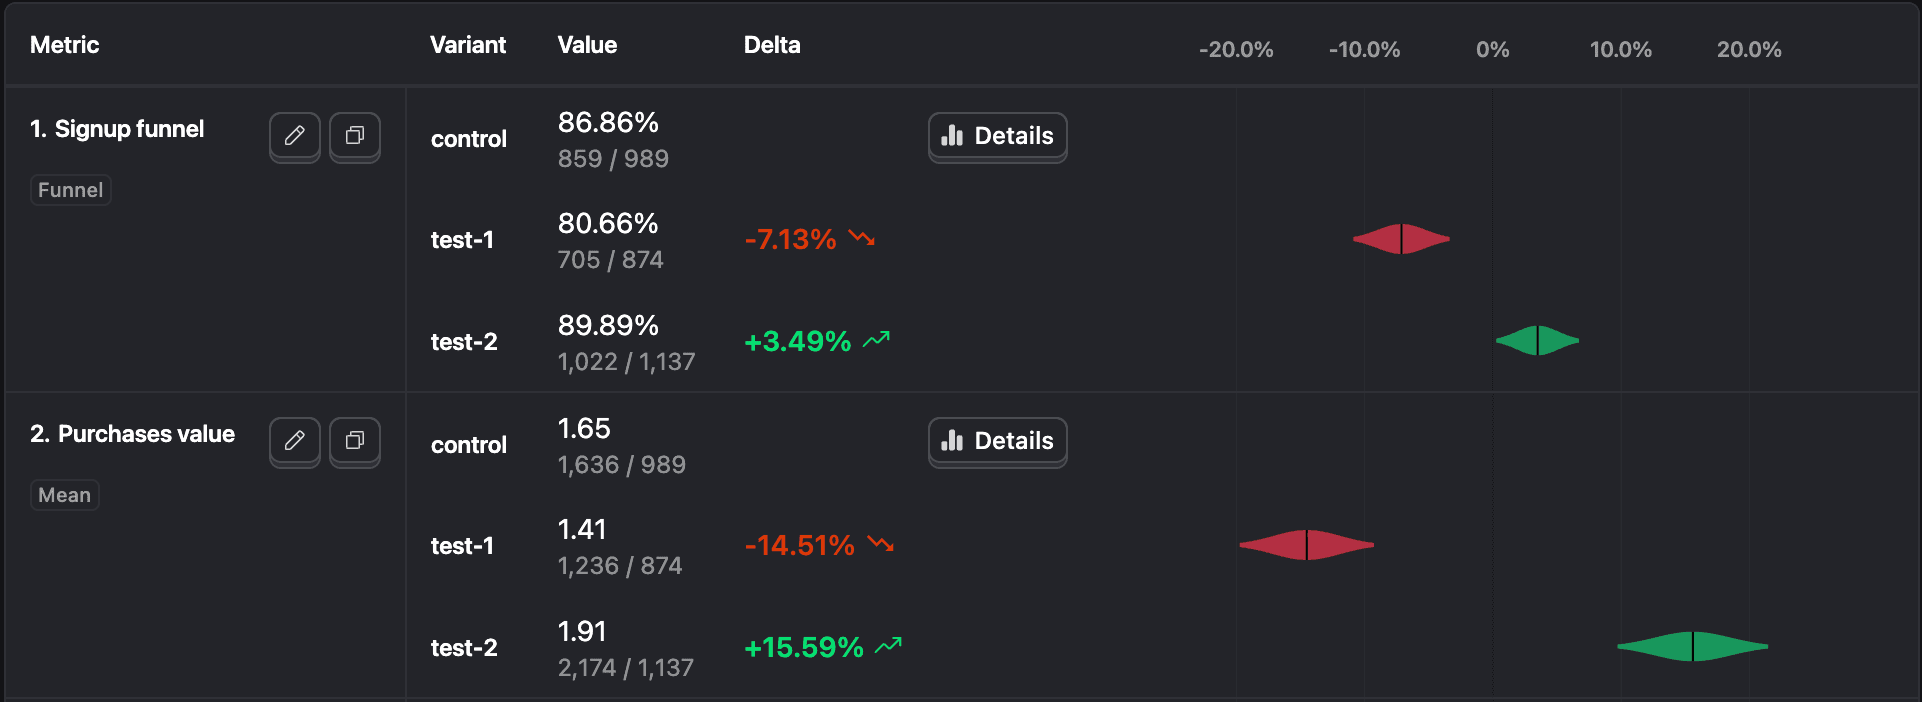
For each metric you're tracking, PostHog displays a delta chart showing the performance of each variant compared to the baseline (which defaults to control):
How to determine if a variant is significant
The most important question when analyzing results is: "Is my variant statistically significant?"
Look for these clear visual indicators in the delta chart:
Color-coded deltas: When a variant achieves statistical significance:
- Green: The variant is winning (achieving the desired change)
- Red: The variant is losing (moving opposite to the desired direction)
- No color: The result is not statistically significant
When significant, an arrow (↑ or ↓) indicates whether the metric increased or decreased
Confidence/Credible intervals: The horizontal bars show the 95% confidence interval (frequentist) or credible interval (Bayesian):
- If the interval doesn't cross zero, the result is statistically significant
- The narrower the interval, the more precise your estimate
Hover details: When you hover over a variant in the delta chart, you'll see detailed statistics:

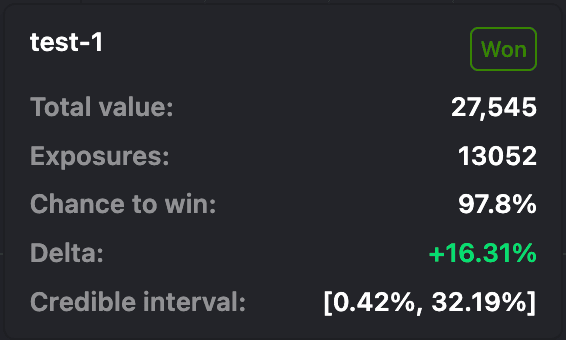
The hover popup shows:
- Significance status: States if the variant "won", "lost", or is "not significant"
- Total value: The actual measured value for this metric (e.g., mean for trends, conversion rate for funnels)
- Exposures: Number of users exposed to this variant (matches the exposures panel)
- Chance to win (Bayesian) or p-value (Frequentist): Statistical confidence measure
- Delta: Percentage change compared to the baseline variant
- Confidence/Credible interval: The range within which the true effect likely falls
Changing the baseline variant
By default, all variants are compared to the control variant. You can change this by going to your experiment's Settings tab and selecting a different Baseline variant.
When you change the baseline, all statistical comparisons – delta, confidence intervals, and significance – are recalculated relative to the new baseline variant. The baseline variant itself shows no delta since it's the reference point.
Viewing detailed results and recordings
Click on any variant in the delta chart to access detailed results. This opens a panel showing the same statistics as the hover popup, plus a View recordings button.
Click View recordings to see session recordings of experiment participants. By default, all metric events are applied as filters to the playlist meaning you'll only see recordings for users who completed the funnel or fired the trend metric. However, the filters don't map exactly to the statistical calculations (funnel attribution type isn't applied, for instance), so the recordings don't map exactly to the experiment results.
You can also click Summarize session replays to have PostHog AI analyze recordings across your experiment variants. This identifies behavior patterns, highlighting differences in how users interact with each variant.
Time series analysis
The time series chart shows how your experiment results change over time, helping you see if your results are stable or still changing.
To view the time series chart, click on any confidence interval bar in the delta chart:
This opens the time series view:
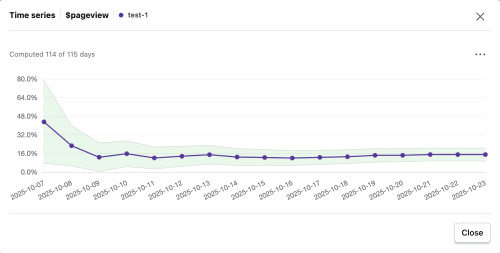
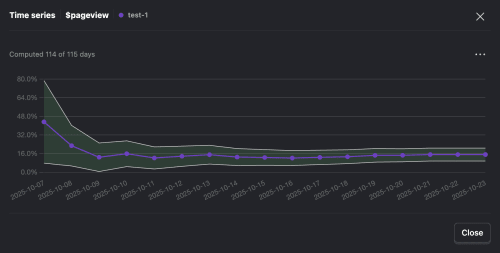
How the chart works:
- Center line: Shows the percentage change between your variants day by day
- Shaded bounds: The confidence interval that gets narrower as you collect more data
- Colored areas:
- Green means the variant is winning with statistical significance
- Red means the variant is losing with statistical significance
- No color means the results aren't significant yet
- Hover for details: Hover over any day to see that day's specific results and whether they were significant
Use this chart to:
- Check if results are stable: Look for results that stay consistent over several days. If your results keep flip-flopping between positive and negative, you might need more time or there could be an issue with your experiment.
- Spot unusual patterns: Find spikes or dips that might be skewing your overall results. For example, a single day with unusual traffic could make your entire experiment look significant when it's actually not.
- Decide when to stop: When the confidence interval narrows and results stay consistent for several days, you have enough data to make a decision.
Interpreting different scenarios
Clear winner
When all your primary metrics show green (positive) significance for a variant:
- You have strong evidence that the variant improves your key metrics
- Consider the magnitude of improvement. Even statistically significant changes might not be practically significant
- Review secondary metrics to ensure no unexpected negative impacts
Mixed results
It's common to see some metrics improve while others decline. When this happens:
- Prioritize your primary metric: Focus on the metric you defined as most important when setting up the experiment
- Understand the trade-offs:
- Is a 5% increase in conversion worth a 2% decrease in average order value?
- Does improved engagement justify slightly lower retention?
- Dig deeper with analytics:
- Break down results in Product analytics by user segments to understand who benefits and who doesn't
- Use Session replays to see how users interact differently with each variant
- Create Cohorts of users from each variant for further analysis
- Consider the user journey: Sometimes negative changes in one metric lead to positive downstream effects
Reading the pattern across metrics
At the default 95% confidence level, any single metric has a 5% chance of showing a significant result even when nothing real changed. Your other metrics help you judge whether a result is real or noise, but only if they're related to each other and to your hypothesis.
Metrics that support each other. You're testing a new onboarding flow:
| Metric | Result |
|---|---|
| Onboarding completion rate (primary) | Significant increase ↑ |
| Time to first key action | Significant decrease ↓ |
| 7-day retention | Slight increase, not significant |
| Support tickets in first week | Flat, not significant |
This is a coherent story. Users are completing onboarding faster and sticking around. You can trust the primary result because the surrounding metrics all point the same direction.
Metrics that can't help you. Same experiment, but your metrics are:
| Metric | Result |
|---|---|
| Onboarding completion rate (primary) | Significant increase ↑ |
| Total pageviews | Not significant |
| Pricing page visits | Not significant |
| Blog bounce rate | Significant decrease ↓ |
| API calls made | Not significant |
Completion rate is significantly up, but the other four metrics have nothing to do with onboarding. They can't confirm or contradict the primary result. If completion rate lit up by chance, you'd have no way to tell. And if blog bounce rate also happens to show significance, that's almost certainly noise, but it might look tempting to claim your onboarding change also "improved content engagement."
The takeaway: Choose metrics that form a system around your hypothesis. When they agree, you have strong evidence. When one stands alone, be skeptical, especially if it's a metric you weren't focused on. If a surprising result looks compelling, run a follow-up experiment with that metric as the primary.
No significant results
If your experiment shows no significant differences:
- Check sample size: You might need more data. Use the sample size calculator to estimate required duration
- Verify implementation: Ensure the variants are actually different and the tracking is working correctly
- Consider effect size: The actual difference might be too small to detect with your current sample size
- Learn from it: Not all experiments win. This is valuable information about what doesn't move the needle
Funnel metrics analysis
For funnel metrics, PostHog provides additional breakdown visualization:
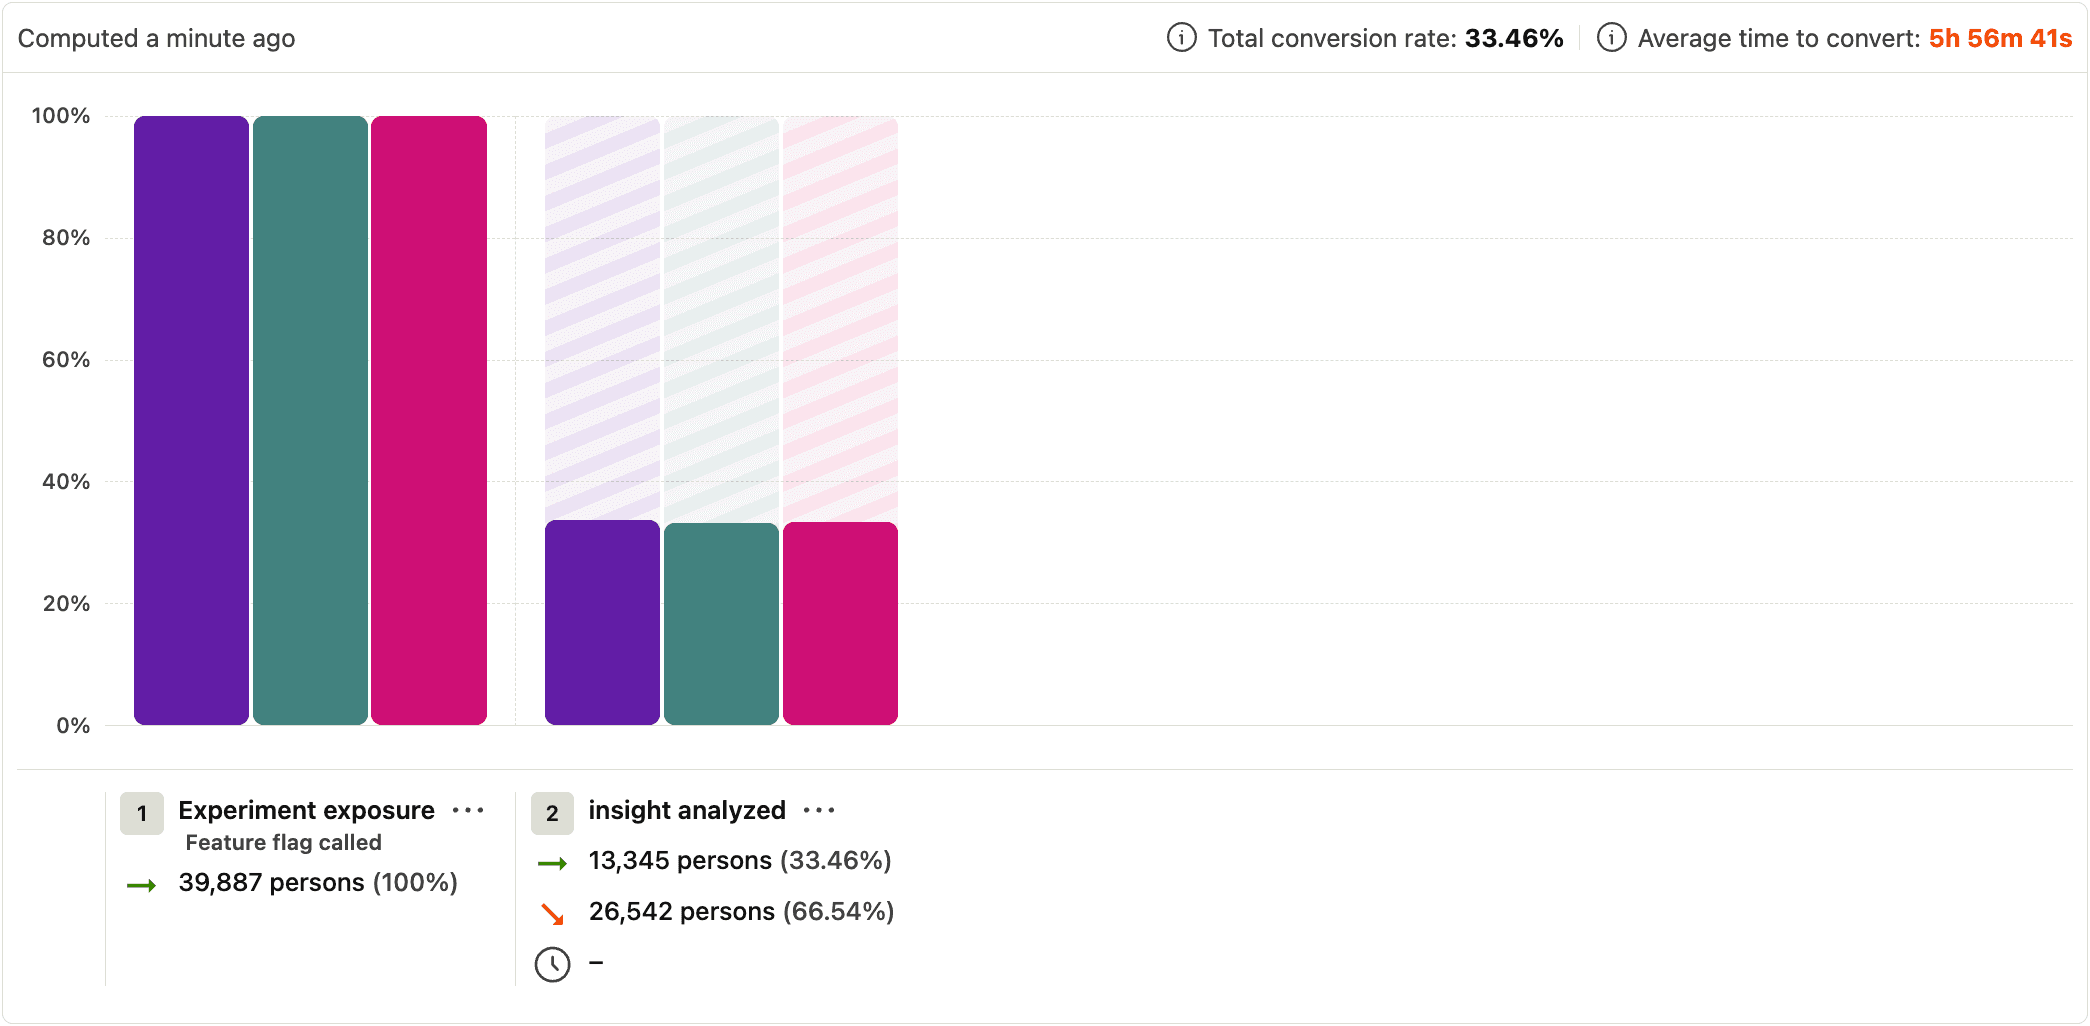
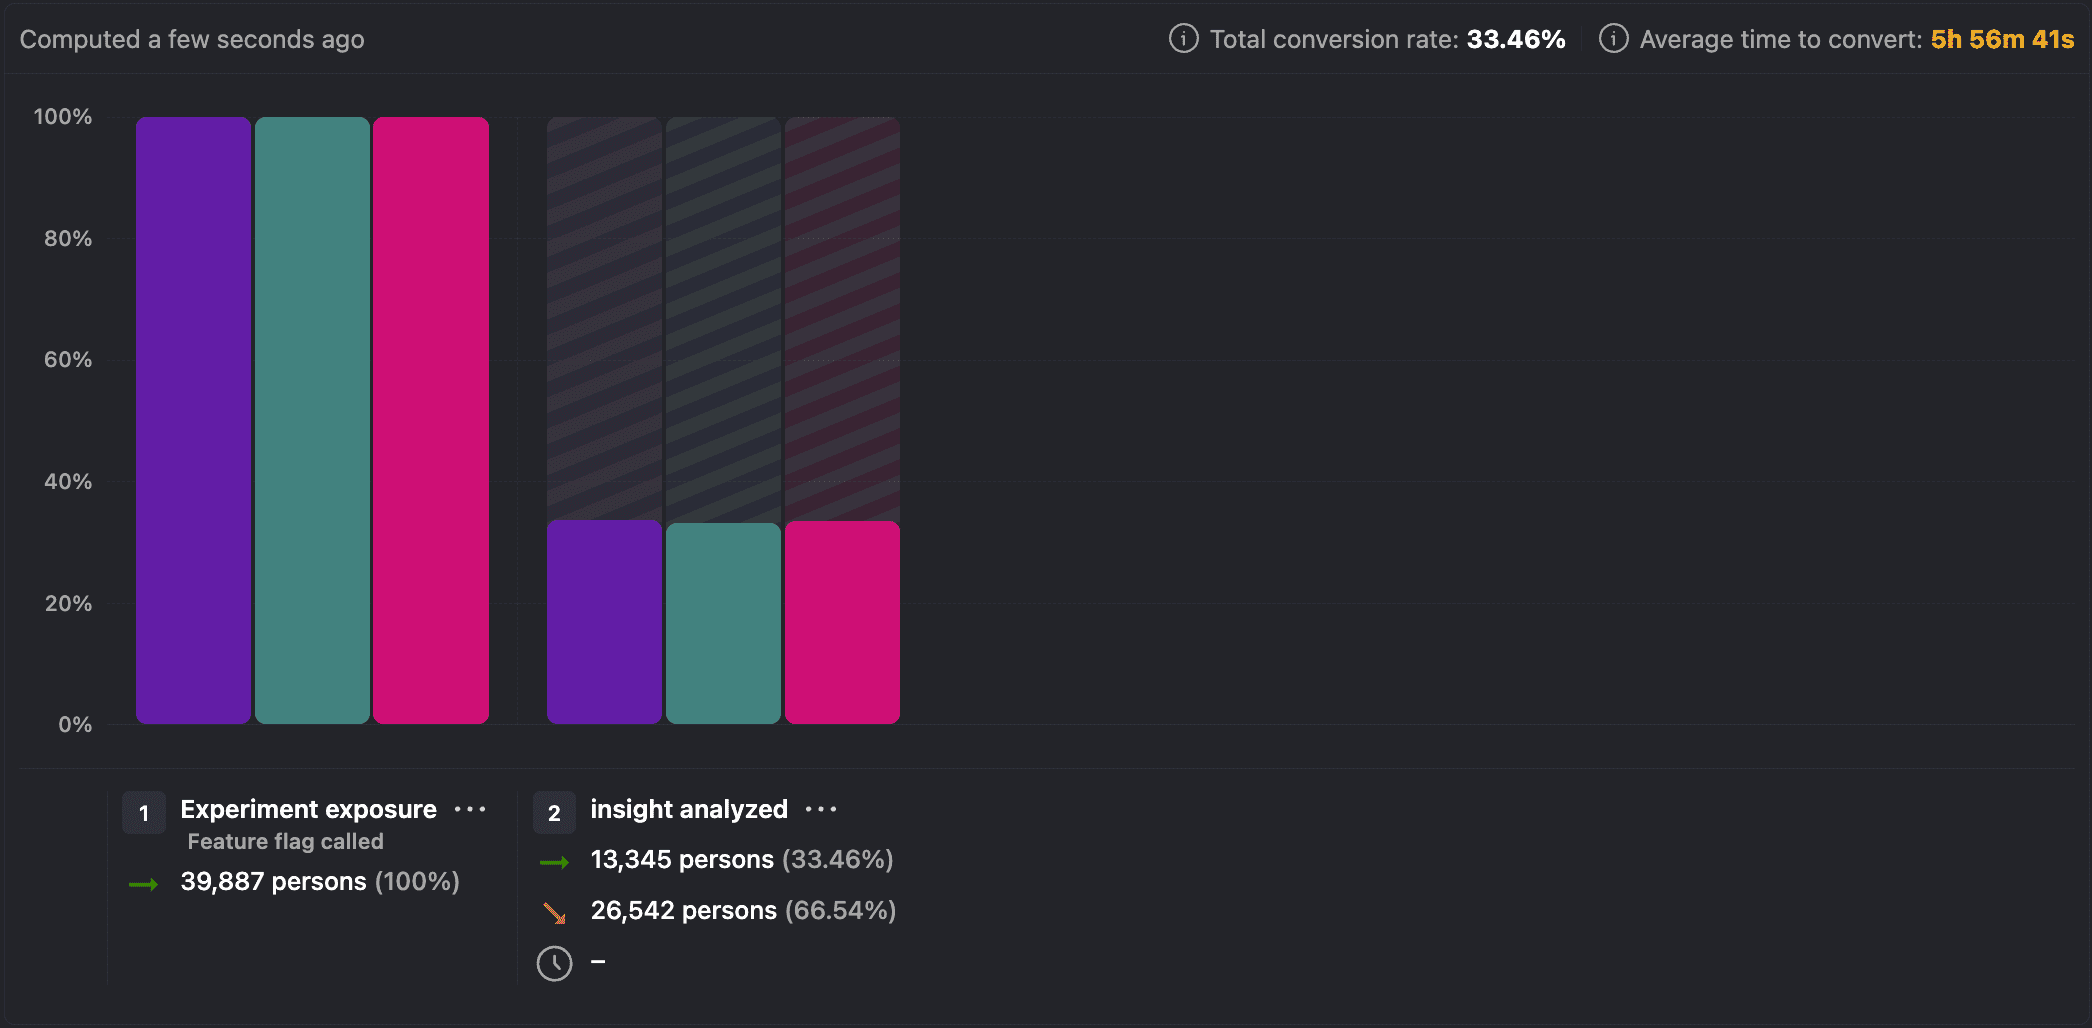
The funnel breakdown shows conversion rates at each step, helping you identify:
- Where users drop off in each variant
- Which steps are most affected by your changes
- Unexpected impacts on parts of the funnel you didn't intend to change
Important: Statistical significance for funnels is always calculated between the first step (exposure event) and the final step. Intermediate steps are shown for analysis but don't affect the significance calculation.