


How to set up MCP analytics and error tracking


Contents
Since this tutorial was published, we've shipped @posthog/mcp – an official (beta) SDK that captures every tool call, error, and the agent's intent automatically. You can set it up with a single instrument(server, posthog) call, or let our wizard do it for you with one command. No wrapper code required. The manual approach below still works and is a great way to understand what's happening under the hood, but most servers should reach for the SDK first.
MCP servers give LLMs powerful capabilities, but without analytics and error tracking you're flying blind with no visibility into usage or performance. Which tools get called? How often? Where are the bottlenecks? What's failing?
There are two ways to add this to your MCP server:
- The quick way – install the official
@posthog/mcpSDK and callinstrument()once. This is the recommended path for most servers. - The manual way – wrap each tool handler yourself with a small higher-order function. This takes more code, but it's a great way to understand the mechanics and gives you full control.
We'll cover the SDK first, then walk through the manual pattern so you can see exactly what the SDK does for you.
The full source code for the manual approach is available in this GitHub repository.
The quick way: the @posthog/mcp SDK
@posthog/mcp wraps your MCP server and captures analytics automatically – no per-tool instrumentation. It supports any TypeScript MCP server built on @modelcontextprotocol/sdk.
The fastest way to set it up is our wizard, which installs the package, adds your posthog-node client, and wires up the instrument() call for you (it also works with LLM coding agents like Cursor):
Prefer to do it by hand, or want to see exactly what the wizard wires up? Install the SDK alongside the PostHog Node.js SDK:
Then call instrument(server, posthog) once at startup. You bring your own posthog-node client and pass it in as the second argument:
That's it. From the first tool call, the SDK emits PostHog events automatically, all prefixed with $mcp_* so they never collide with your other data and all sharing a $session_id derived from the MCP protocol session:
$mcp_tool_callfor every tool invocation (with parameters, response, duration, and error status)$mcp_tools_listfor everytools/listresponse, so you can compare advertised vs. called tools$mcp_initializefor every client handshake (including the MCP client name and version)$exceptionwhenever a tool throws or returnsisError: true, wired into error tracking
It also unlocks signals the manual approach can't easily capture, each a one-line option on instrument():
- Agent intent – the why behind each call, captured as
$mcp_intent - Identifying users – attribute calls to a real user behind the agent
- Missing capabilities – a queryable feed of things agents wished your server supported
Remember to drain queued events on shutdown by calling posthog.shutdown() (or posthog.flush()) from your SIGTERM handler, since you own the client's lifecycle.
Note:
@posthog/mcpis in beta (pre-1.0). The API may still change – including breaking changes in minor0.xreleases – so pin a specific version while we iterate. Running a custom dispatcher with no server object to wrap? See Custom servers.
To go deeper, see the getting started guide, the installation docs, and the event reference.
Building it yourself (how it works under the hood)
Prefer full control, want to understand the mechanics, or building something the SDK doesn't cover yet? The rest of this tutorial walks through the manual wrapper pattern – essentially a hand-rolled version of what instrument() does for you. This implementation tracks every tool execution without touching core business logic.
In the finished setup, the MCP server:
- Tracks execution time for every tool call
- Captures errors with context
- Sends data to PostHog
Prerequisites
- Node.js 18+
- PostHog account (sign up for free)
- Claude Desktop or another MCP client to test your MCP server
- Basic TypeScript knowledge
- Code editor (e.g., VS Code, Cursor)
MCP's design and the wrapper pattern
MCP servers have an architecture that makes the wrapper pattern a natural fit for extended functionality like analytics and error tracking.
Why? MCP's functional design means wrapper patterns work seamlessly, unlike other web frameworks with middleware pipelines or class-based systems with decorators.
Here's what the boilerplate code looks like for MCP tool registration:
Since MCP tools are mostly just async functions passed to server.tool(), wrapping the handler function is a clean and lightweight way of adding or extending functionality – in this case, analytics and error tracking.
1. MCP server setup
To get us started quickly, we've built an MCP server for you to add product analytics and error tracking to. Start by cloning the repository.
Next, install the dependencies.
Finally, build the server.
You should see a /build directory with the compiled MCP server in the root of the project. Your directory structure should look like this:
2. Tool definitions
Now that we built our MCP server, let's take a look our MCP tools in the tools.ts file.
For this tutorial, we've hardcoded simple datasets and results for the tools to fetch.
Notice that these tools contain only business logic, with zero dependencies on analytics or error tracking libraries. Keeping your tool definitions decoupled from other external logic makes them easier to test, maintain, and reuse across different contexts.
3. MCP analytics provider interface
Next, let's take a look at the TypeScript interface for the MCP analytics provider in the analytics.ts file. It defines a standard set of methods for sending analytics data from your MCP server.
It has three core abilities:
- Track tool calls
- Capture errors
- Close the analytics client
This approach makes your code testable and flexible.
Think of the interface as a generic adapter for analytics calls. Want to use a different analytics provider? Write a new implementation. Need to debug locally? Create a file-based logger. Running tests? Use a no-emit version that tracks calls without sending data.
4. withAnalytics() wrapper
In the same analytics.ts file, let's explore the core design pattern: the withAnalytics() wrapper that intercepts every tool call. The wrapper function is responsible for invoking the analytics provider methods defined in the previous step.
The withAnalytics() function:
- Times every tool call execution
- Tracks success/failure
- Preserves normal error handling
- Works without an analytics provider
5. PostHog product analytics and error tracking
Now let's send those analytics somewhere useful. In the posthog.ts file, we initialize the PostHog client that implements the AnalyticsProvider interface and extends it with the necessary calls to capture data and send it to PostHog.
The PostHogAnalyticsProvider class leverages the PostHog Node.js SDK to capture custom events for product analytics and exceptions for built-in error tracking.
6. Registering tools using withAnalytics()
Now let's see how these tools are registered with the MCP server in the server.ts file.
Notice how each tool handler function is wrapped with the withAnalytics() wrapper we saw earlier. Every tool call is tracked by the PostHogAnalyticsProvider class, capturing analytics, tracking errors, and sending data to PostHog.
7. Injecting the PostHogAnalyticsProvider
In the main index.tsx file, the PostHogAnalyticsProvider is injected into the MCP server on initialization.
8. Testing the MCP server
Now we can test our MCP server with Claude Desktop, or any compatible MCP client, to see MCP analytics in action.
Note: The client will run our server as a child process so we don't need to run our server in our terminal. We modify the Claude's config file to make sure the Claude Desktop can run our build.
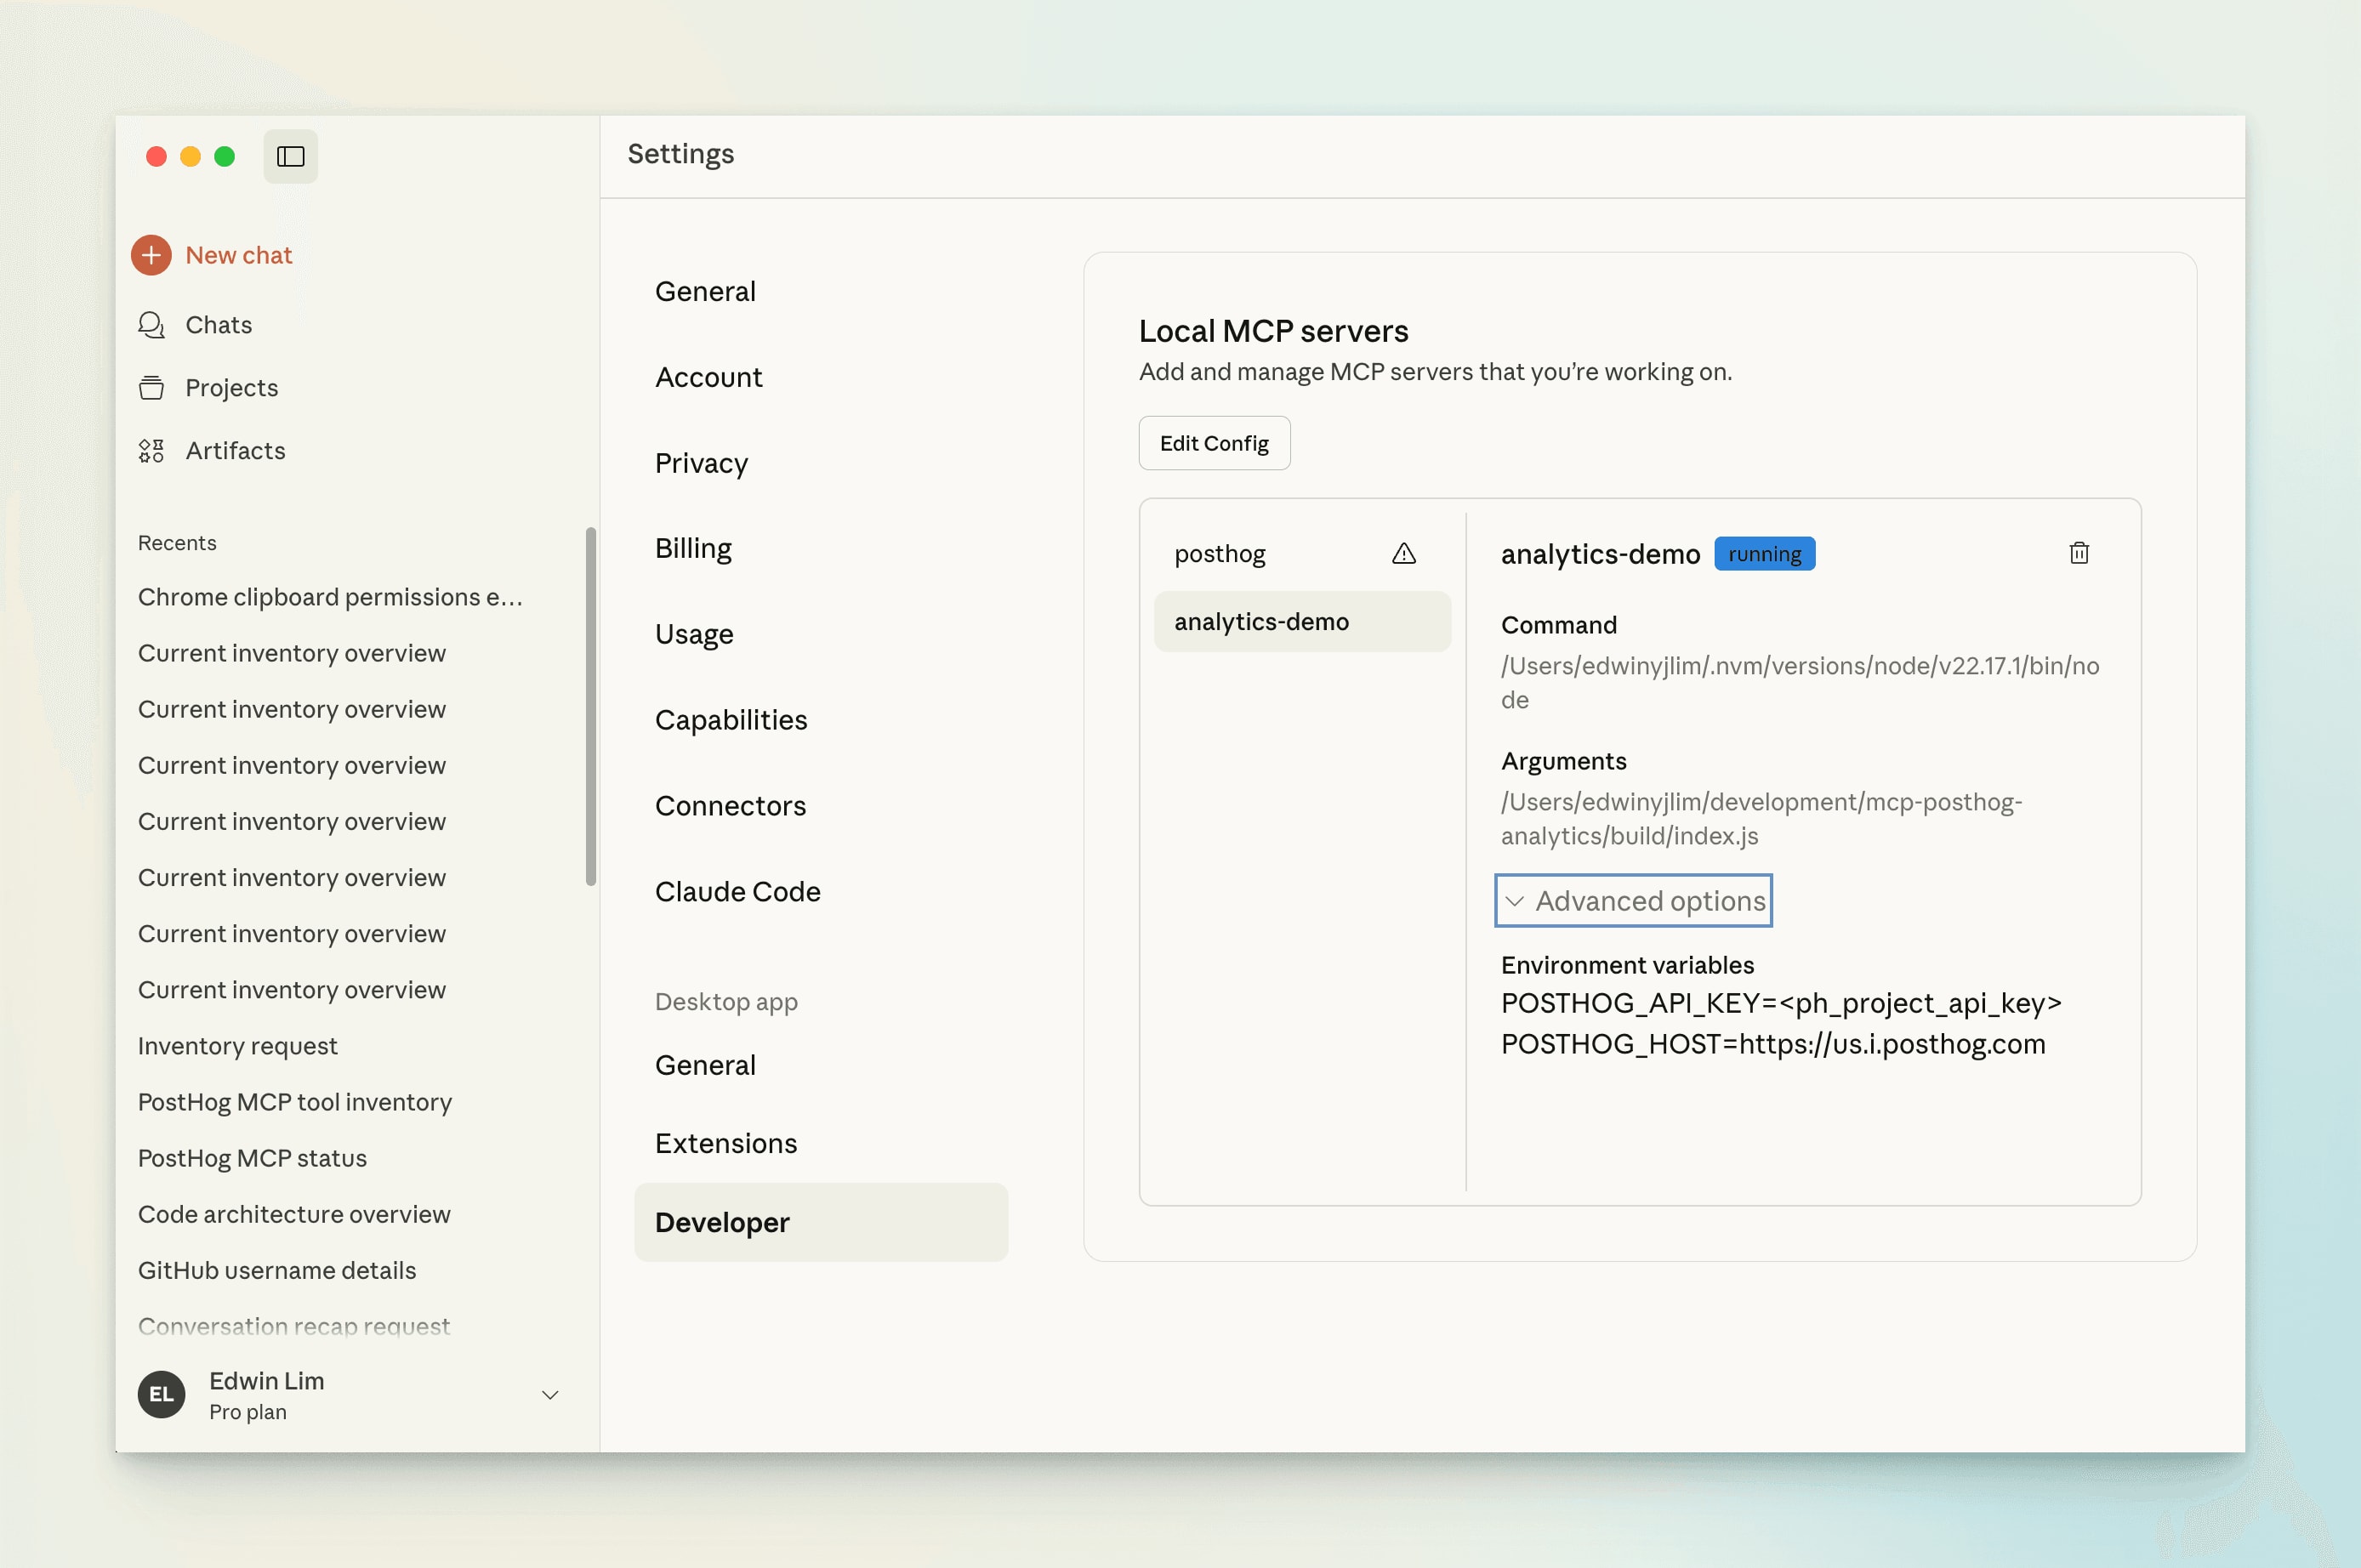
Open Claude Desktop's Settings > Developer. Then select Edit Config to open the configuration file.
Update the claude_desktop_config.json file to include the following:
It should look like the following in Claude Desktop's Settings > Developer:
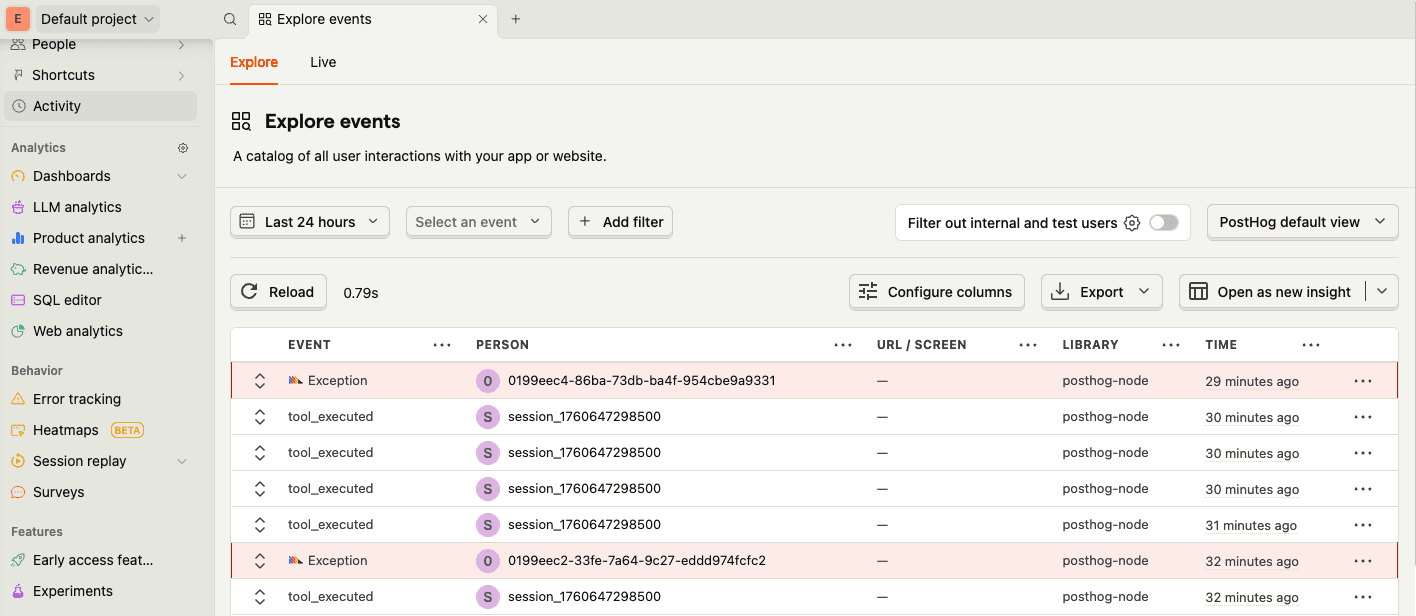
You can then try these prompts:
- "Show me the inventory" → Should successfully return the inventory.
- "Check stock for product 999" → Should throw an error.
- "Analyze this data: quarterly sales" → Simulates a slow operation.
9. Create MCP analytics dashboards
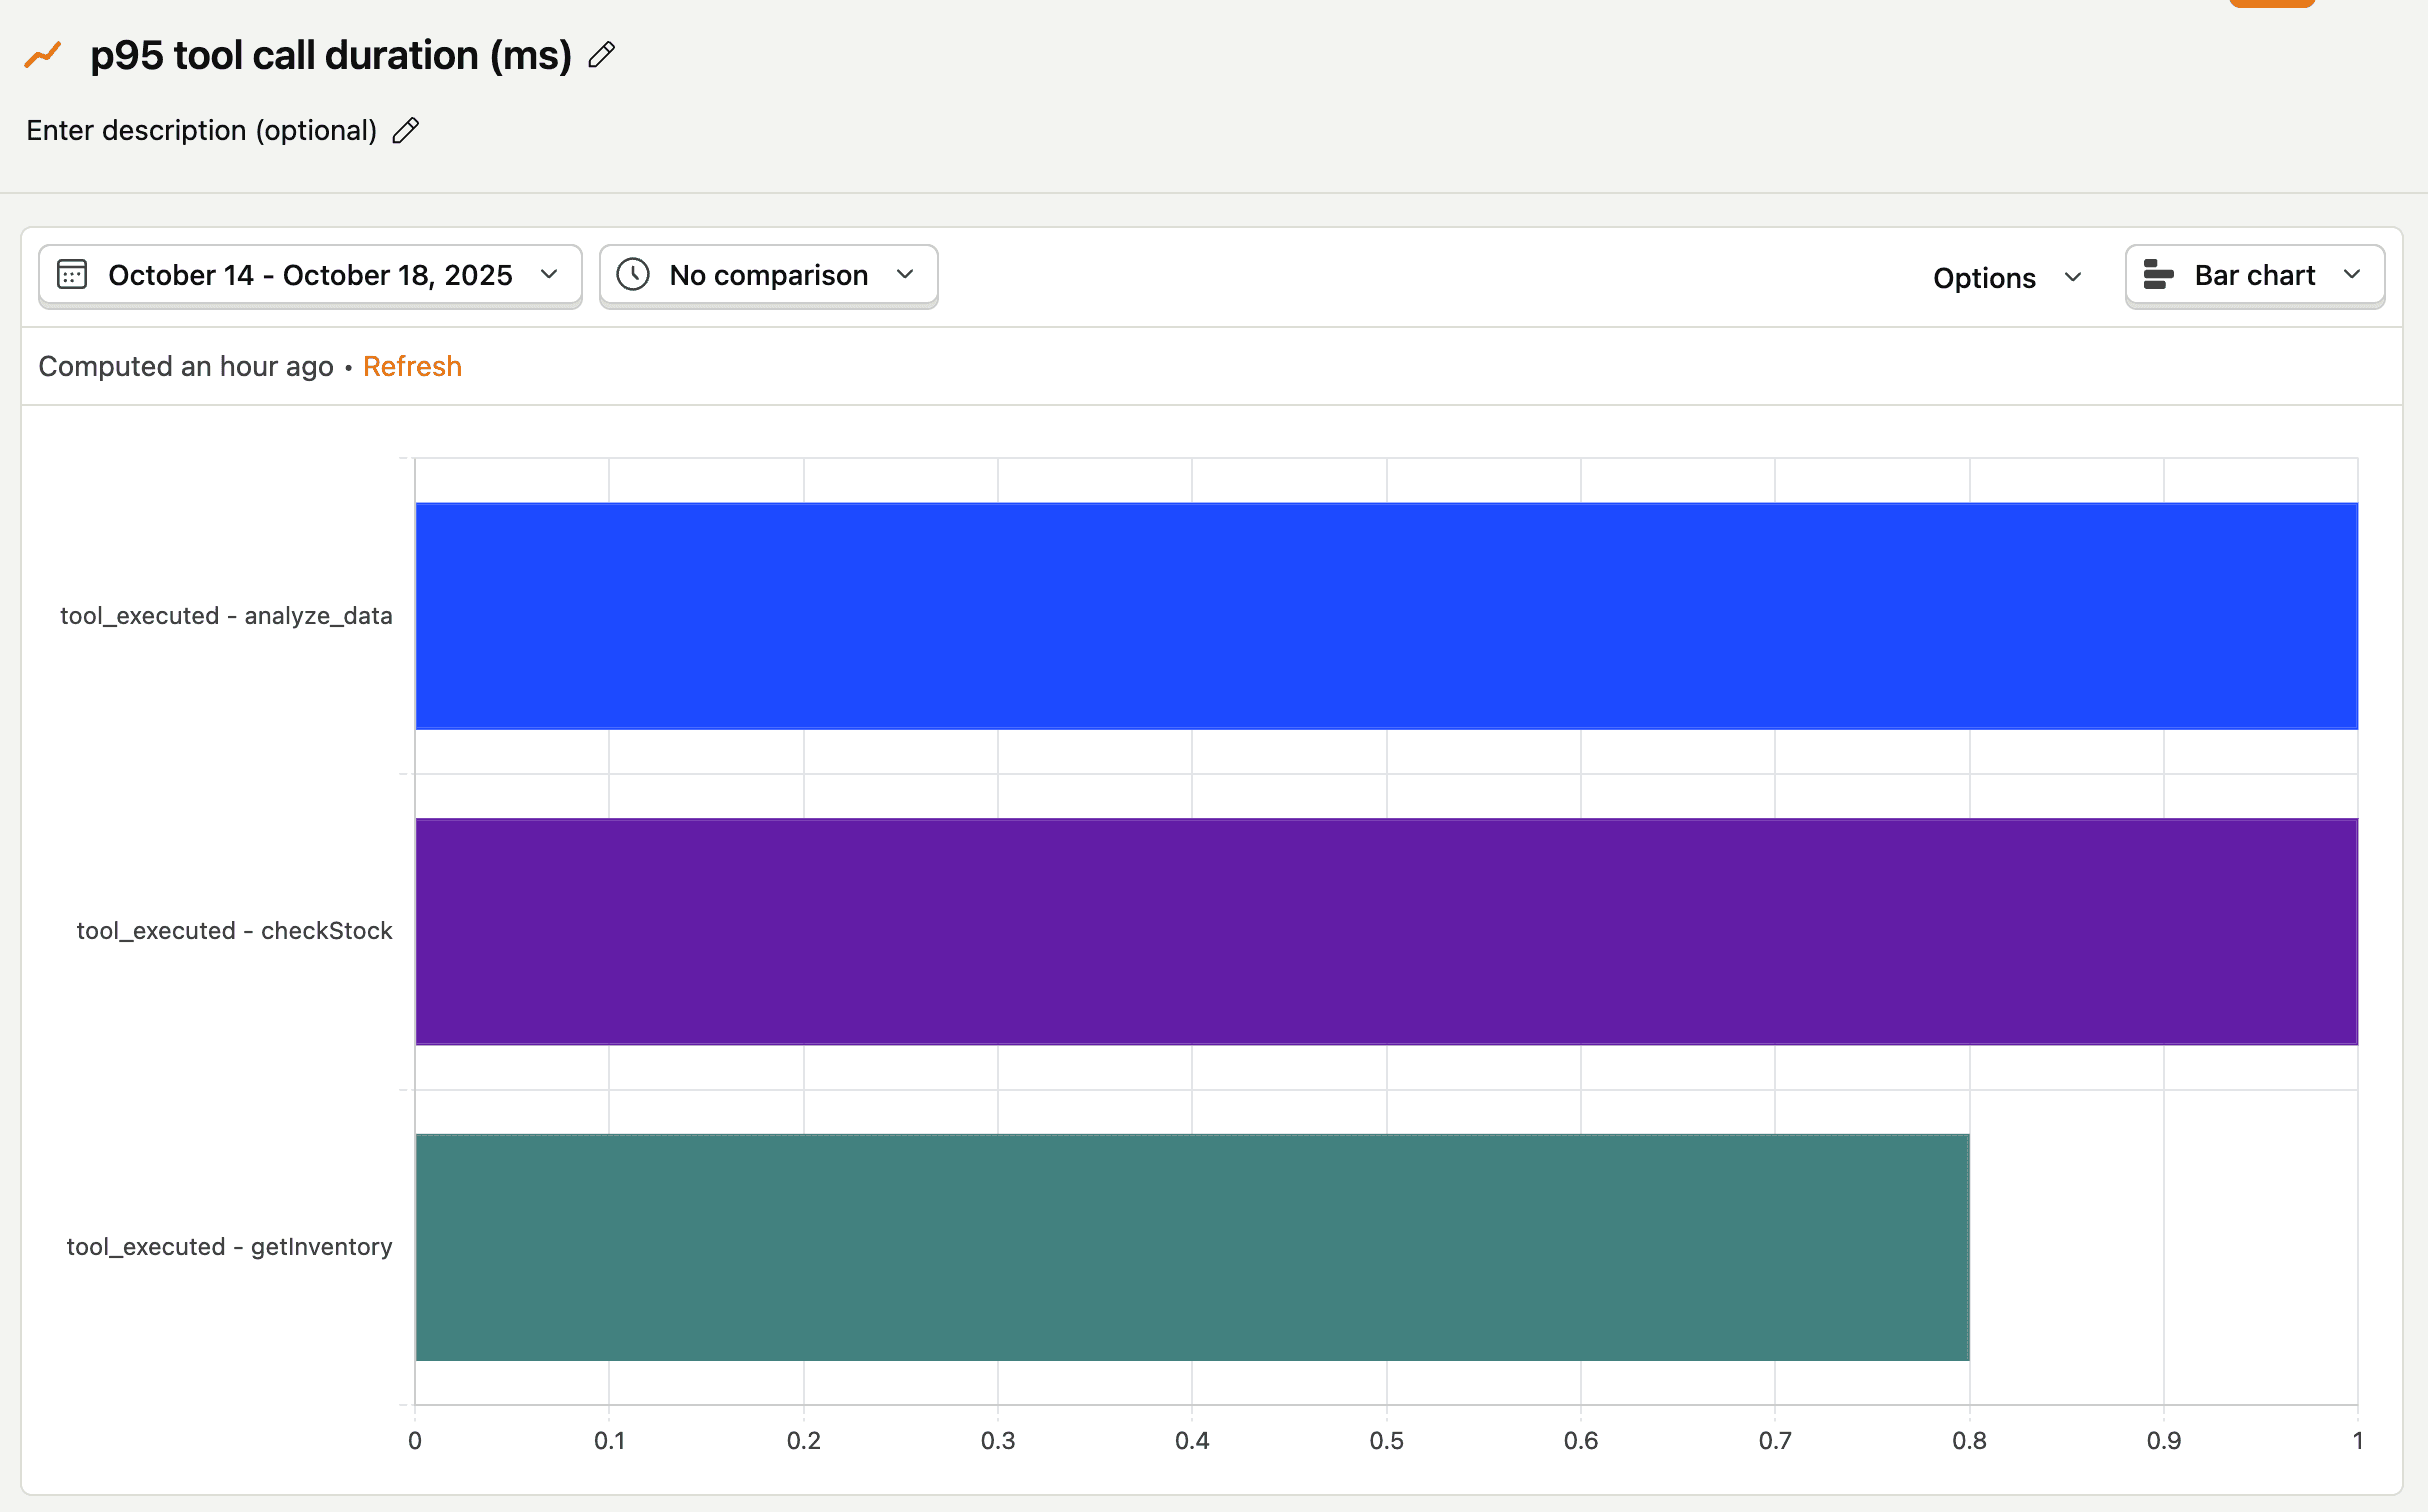
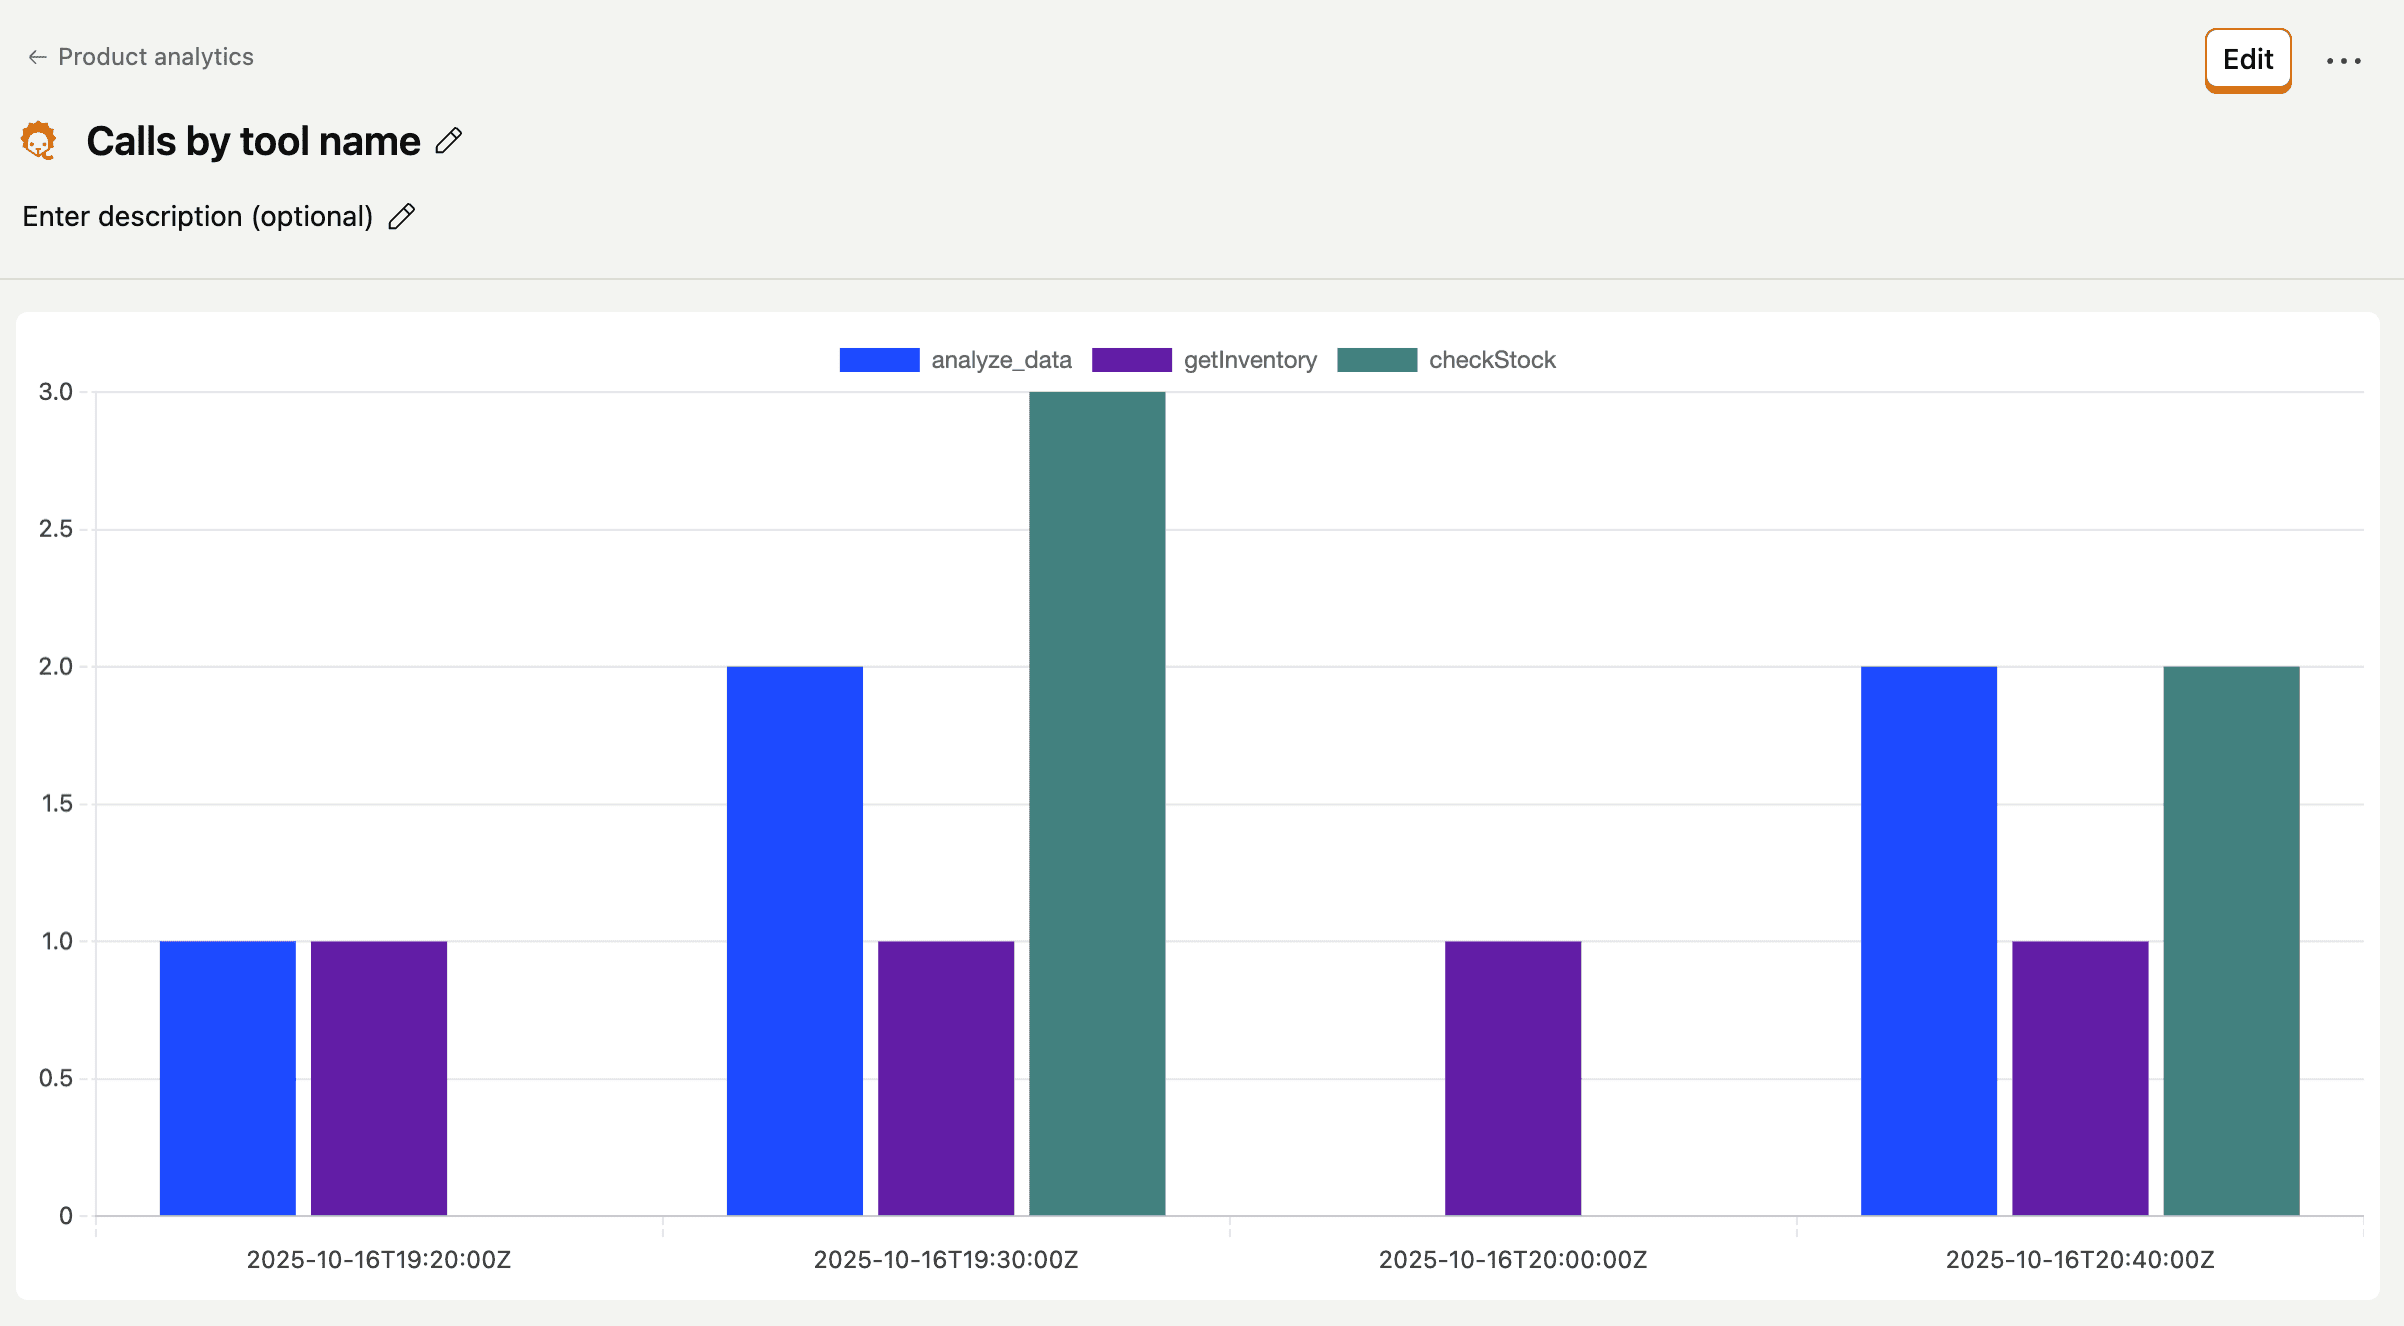
Now that our MCP server is creating MCP analytics and sending them as events to PostHog, we can build insights and dashboards in PostHog to visualize the data. We can set up:
- Performance dashboards
- Reliability dashboards
- Usage dashboards
Further reading
- MCP analytics docs – the official
@posthog/mcpSDK - Every event the SDK emits and copy-paste queries
- Complete code for the manual approach on GitHub
- MCP: machine copy/paste
- What we've learned about AI-powered features
- Avoid these AI coding mistakes
This tutorial was written by Arda Eren, a very rad member of the PostHog community.
PostHog is the leading platform for building self-driving products. With a full suite of developer tools – AI observability, product analytics, session replay, feature flags, experiments, error tracking, logs, and more – PostHog captures all the context agents need to diagnose problems, uncover opportunities, and ship fixes. A data warehouse and CDP tie it all together, unifying that context into one source agents can read across. You can steer it all from Slack, the web app, the desktop (PostHog Desktop), or your own editor via the MCP.