


Product analytics with autocapture
Product Analytics is one of the tools that makes your product self-driving: the measurement agents use to see what works. Built to natively work with session replay, feature flags, experiments, and surveys.
Install with AI in a single prompt
Paste into your terminal or code editor and make AI do the work.
What does it do?
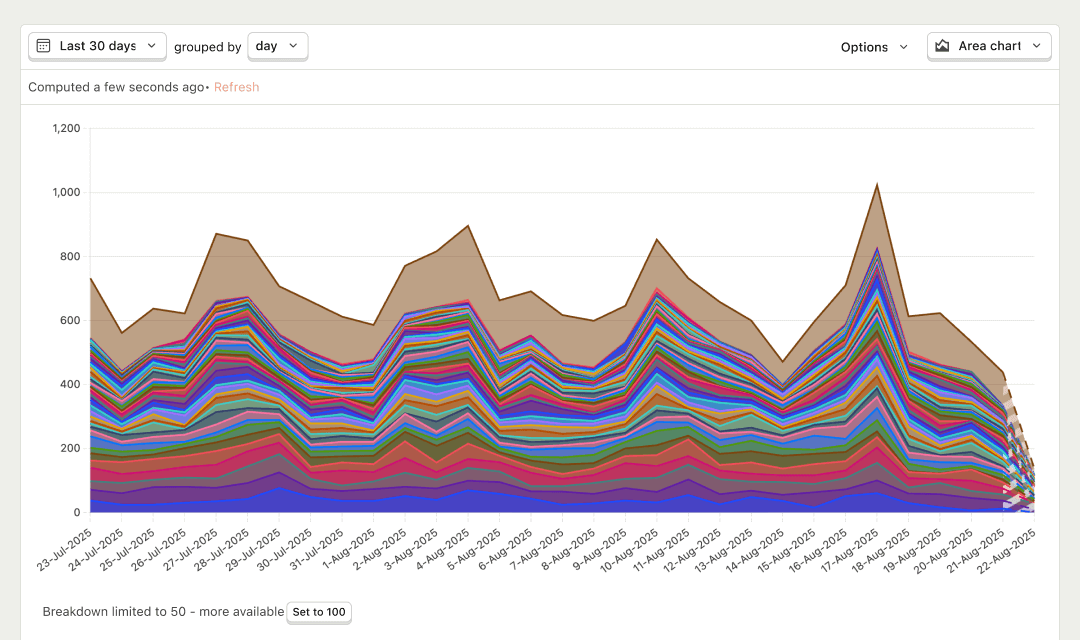
Product Analytics turns what people do in your product into answers you can act on. Autocapture tracks pageviews, clicks, and form submissions without extra code. From there you build trends, funnels, retention curves, paths, and SQL queries – then jump straight into the session recordings behind any data point when you need the 'why'.
Who is it for?
Product Analytics is used across teams depending on your role.
How do I use it?
There are a few ways to explore Product Analytics.
Query product data without leaving your editor
Query trends, funnels, retention, and usage metrics from Cursor, Claude Code, VS Code, or any MCP-compatible agent.
Top features
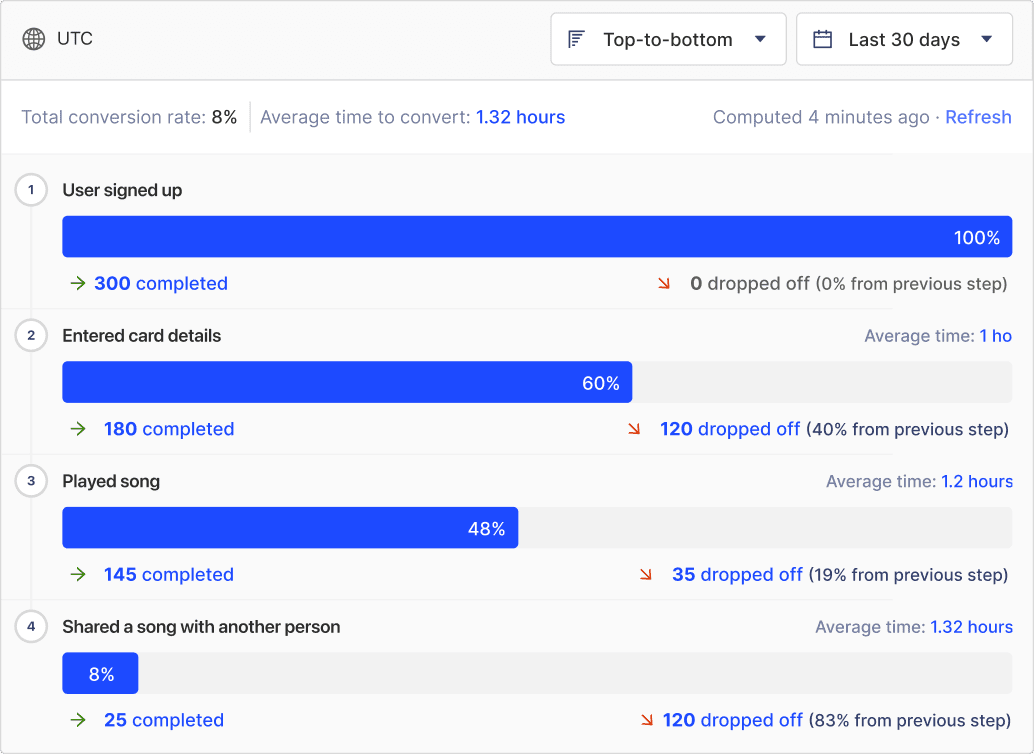
Find drop-off across a series of actions
Find where people drop off across a series of actions – then jump from any step into the matching session recordings.
AI prompts
Ask PostHog AI to answer product questions, build insights, and write SQL. Works in PostHog AI (in-app chat), PostHog Desktop (our AI code editor), and in your product editor (using the MCP). Already signed in? Click a prompt to try it.
Trends & usagequery-trends
Funnelsquery-funnel
Retentionquery-retention
Build & saveinsight-create
Install
Autocapture works out of the box on web. Add an SDK for mobile or backend when you need custom events.
Web frameworks
Popular


All


Feature comparison
Questions?
Answers
There are a few ways you can get answers to specific questions about Product Analytics.
- Check the docs
We have an entire docs-wizard dedicated to docs gardening.
- Search the community forums
With over 600 discussions about Product Analytics, there's a good chance your answer is already answered!
- Ask PostHog AI
It's an incredibly useful AI chat that understands the product, docs, community questions, our codebase, GitHub issues, and industry knowledge.
- Talk to a human
Dedicated humans are standing by and ready to assist. Best for questions about volume pricing, terms, and sexy legal stuff.
Works with other PostHog tools
Use Product Analytics with these other PostHog apps to maximize shareholder value.
Works with...
Session Replay
Jump into a playlist of session recordings directly from any point in a graph, or segment of a funnel
Feature Flags
See which feature flags are enabled for a user's session
Experiments
Generate a playlist of recordings limited to an A/B test or specific group within a multivariate experiment.
Get started – free
No credit card required. You get the first 1,000,000 events free every month, then pricing starts at $0.00005/event and reduces with volume.