


Inline code intelligence and annotations
Contents
The VS Code extension analyzes your source code in real time and overlays PostHog data directly in the editor. It detects PostHog SDK calls — capture(), isFeatureEnabled(), getFeatureFlag(), and others — and annotates them with live analytics, flag status, and contextual actions.
SDK detection
The extension automatically recognizes standard PostHog client patterns like posthog.capture(), posthog.isFeatureEnabled(), and similar calls. It also detects SDK initialization and shows a summary of your configuration with validation warnings if something looks off.
Custom client names
If your codebase wraps the PostHog client in a custom variable, configure the extension to recognize it:
posthog.additionalClientNames— Add variable names like["analytics", "ph"]so the extension recognizesanalytics.capture()the same way it recognizesposthog.capture().posthog.detectNestedClients— When enabled (default), detects nested member expressions likewindow.posthog?.capture()orthis.analytics.posthog.capture().posthog.additionalFlagFunctions— Add bare function names like["useMyFlag"]that accept a flag key as the first argument. This is useful for custom hooks or wrapper functions.
These settings can also be shared across your team via a .posthog.json configuration file.
Feature flag status
Next to every isFeatureEnabled(), getFeatureFlag(), or similar call, the extension shows the current flag status:
- Enabled/disabled indicator with color coding
- Rollout percentage for partially rolled out flags
- Variant name for multivariate flags
- Experiment status if the flag is linked to an experiment, including win/loss/inconclusive results

Unrecognized flag keys
If you reference a flag key that doesn't exist in your PostHog project, the extension shows a yellow underline warning. You can use the quick-fix action to create the flag directly from your editor.

Event sparklines
Every capture() call in your code gets a 7-day event volume sparkline displayed inline. This shows you at a glance how frequently each event fires, helping you identify dead events or unexpected spikes without leaving your editor.

Display modes
Control how inline hints appear with posthog.inlineHintsMode:
always(default) — Annotations are visible on every line with a detected PostHog callcurrentLine— Annotations only appear on the line your cursor is on, keeping the editor cleaner
You can also toggle all inline decorations on or off with posthog.showInlineDecorations.
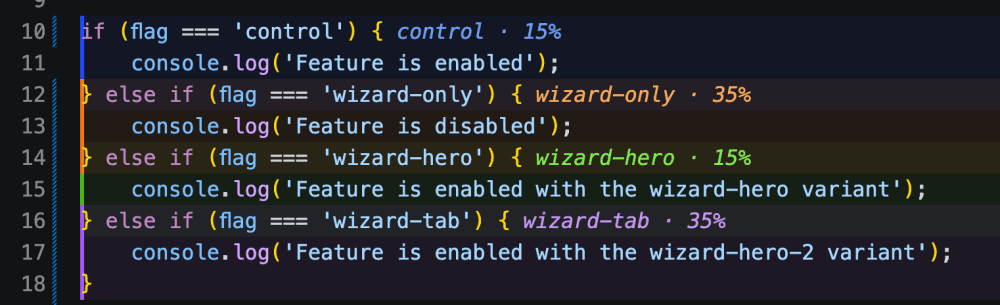
Experiment variant highlighting
When a feature flag is part of an experiment, the extension highlights the code paths for each variant with color coding. This makes it easy to see which code runs for which variant at a glance.
The extension also shows the experiment results inline — whether a variant is winning, losing, or still inconclusive.
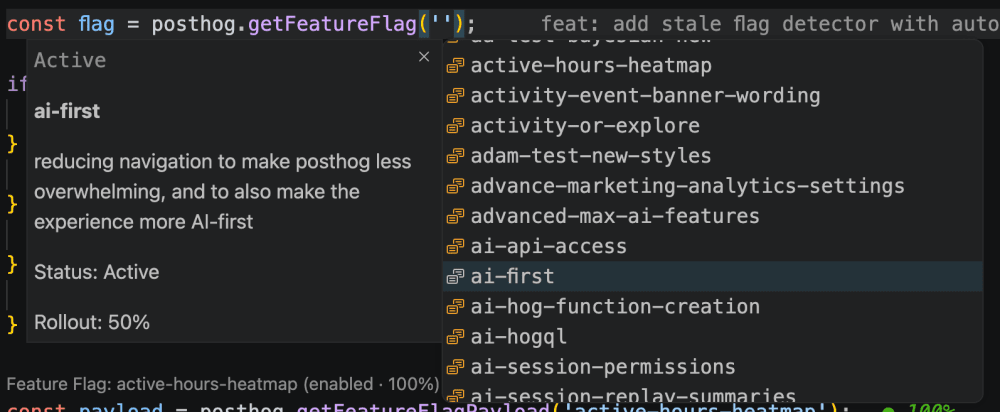
Autocomplete
The extension provides IntelliSense autocomplete suggestions for:
- Feature flag keys — When typing a string argument to
isFeatureEnabled()orgetFeatureFlag() - Event names — When typing a string argument to
capture() - Event properties — When typing property keys in a
capture()properties object - Variant names — When typing expected variant values
Suggestions are pulled from your PostHog project data, so they always reflect your actual flags and events.
Typo detection
The extension uses Levenshtein distance matching to detect likely typos in event names. If you type capture("page_veiw") but your project has an event called page_view, the extension flags it with a warning and suggests the correct name.
CodeLens
Above each capture(), isFeatureEnabled(), and getFeatureFlag() call, the extension displays CodeLens links with contextual actions:
- Open in PostHog — Jump to the flag, experiment, or event definition in your browser
- View sessions — See sessions where this event was triggered
- Show detail — Open the flag or experiment detail panel in the sidebar
- Session and user counts — See how many sessions and users triggered this event (see session replay)
Cmd+click navigation
You can Cmd+click (or Ctrl+click) on a feature flag key or event name string to open its details directly in PostHog in your browser. This works anywhere a flag key or event name appears as a string literal in your code.