


Traces
Contents
Traces are a collection of generations and spans that capture a full interaction between a user and an LLM. The traces tab lists them along with the properties autocaptured by PostHog like the person, total cost, total latency, and more.
Sessions vs Traces
- Trace (
$ai_trace_id): Groups related generations and spans together. Required for all AI Observability events. - Session (
$ai_session_id): Optional property that groups multiple traces together based on your chosen grouping strategy.
See the Sessions documentation for more details on how to use $ai_session_id.
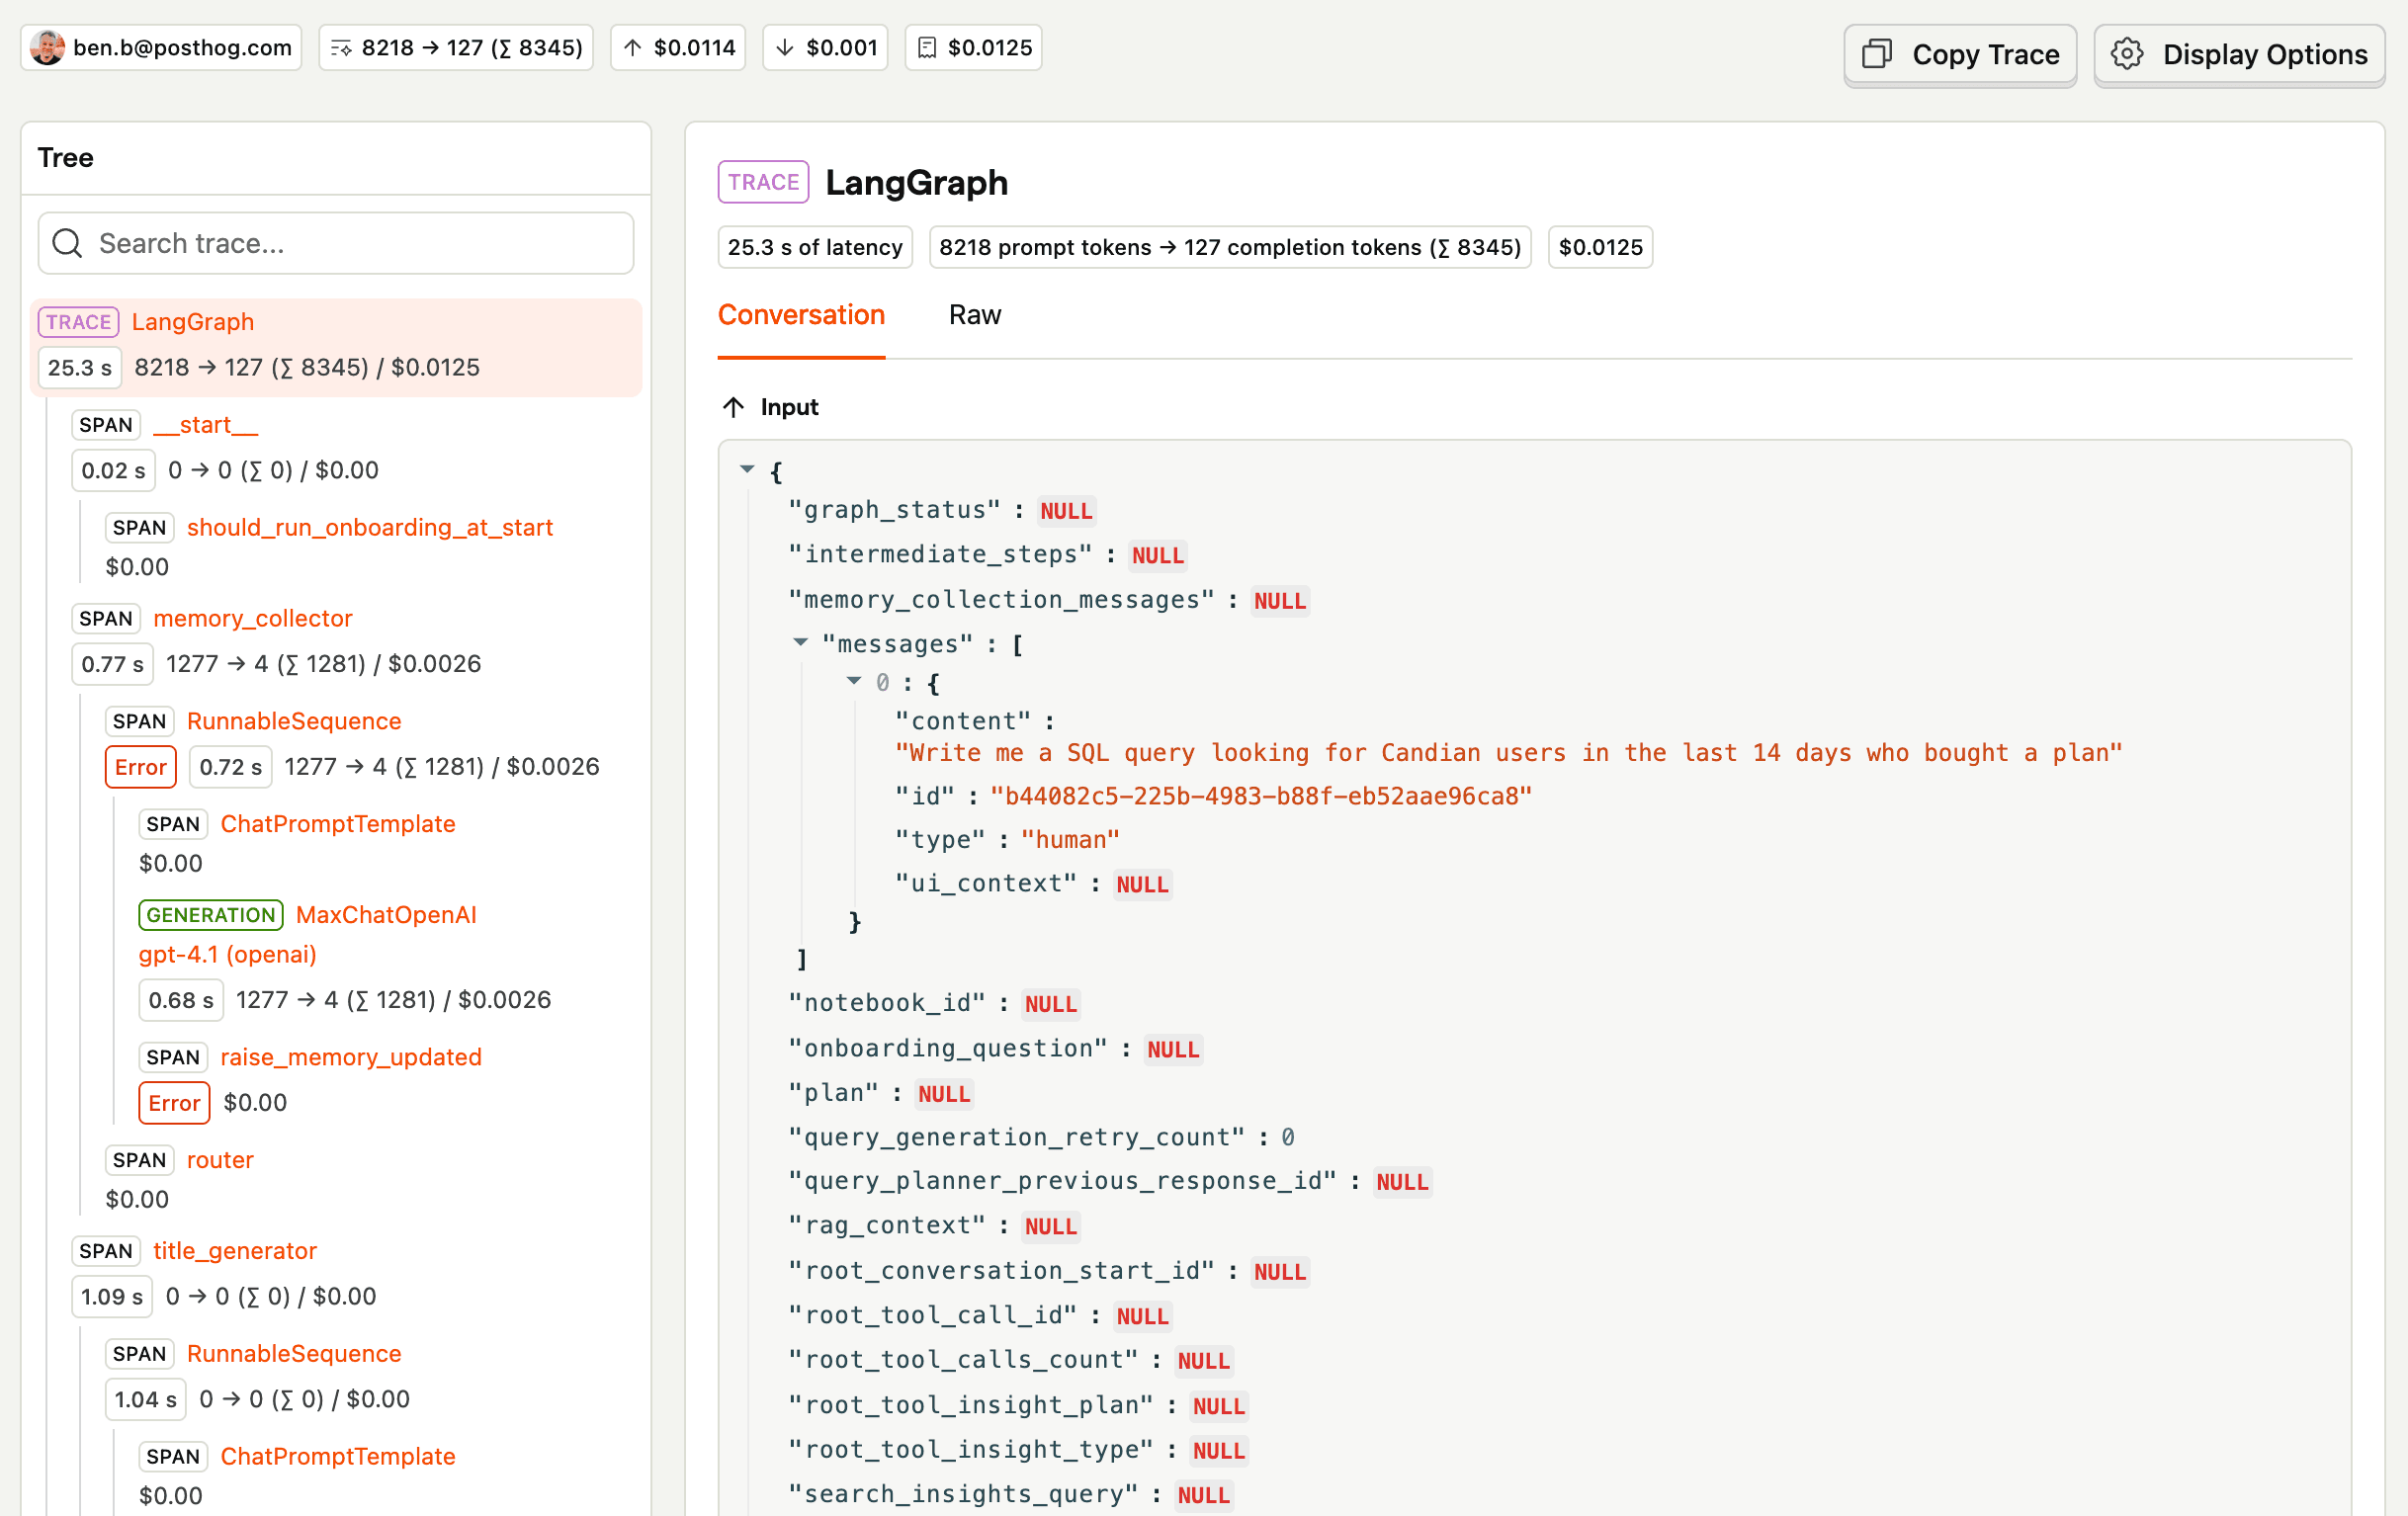
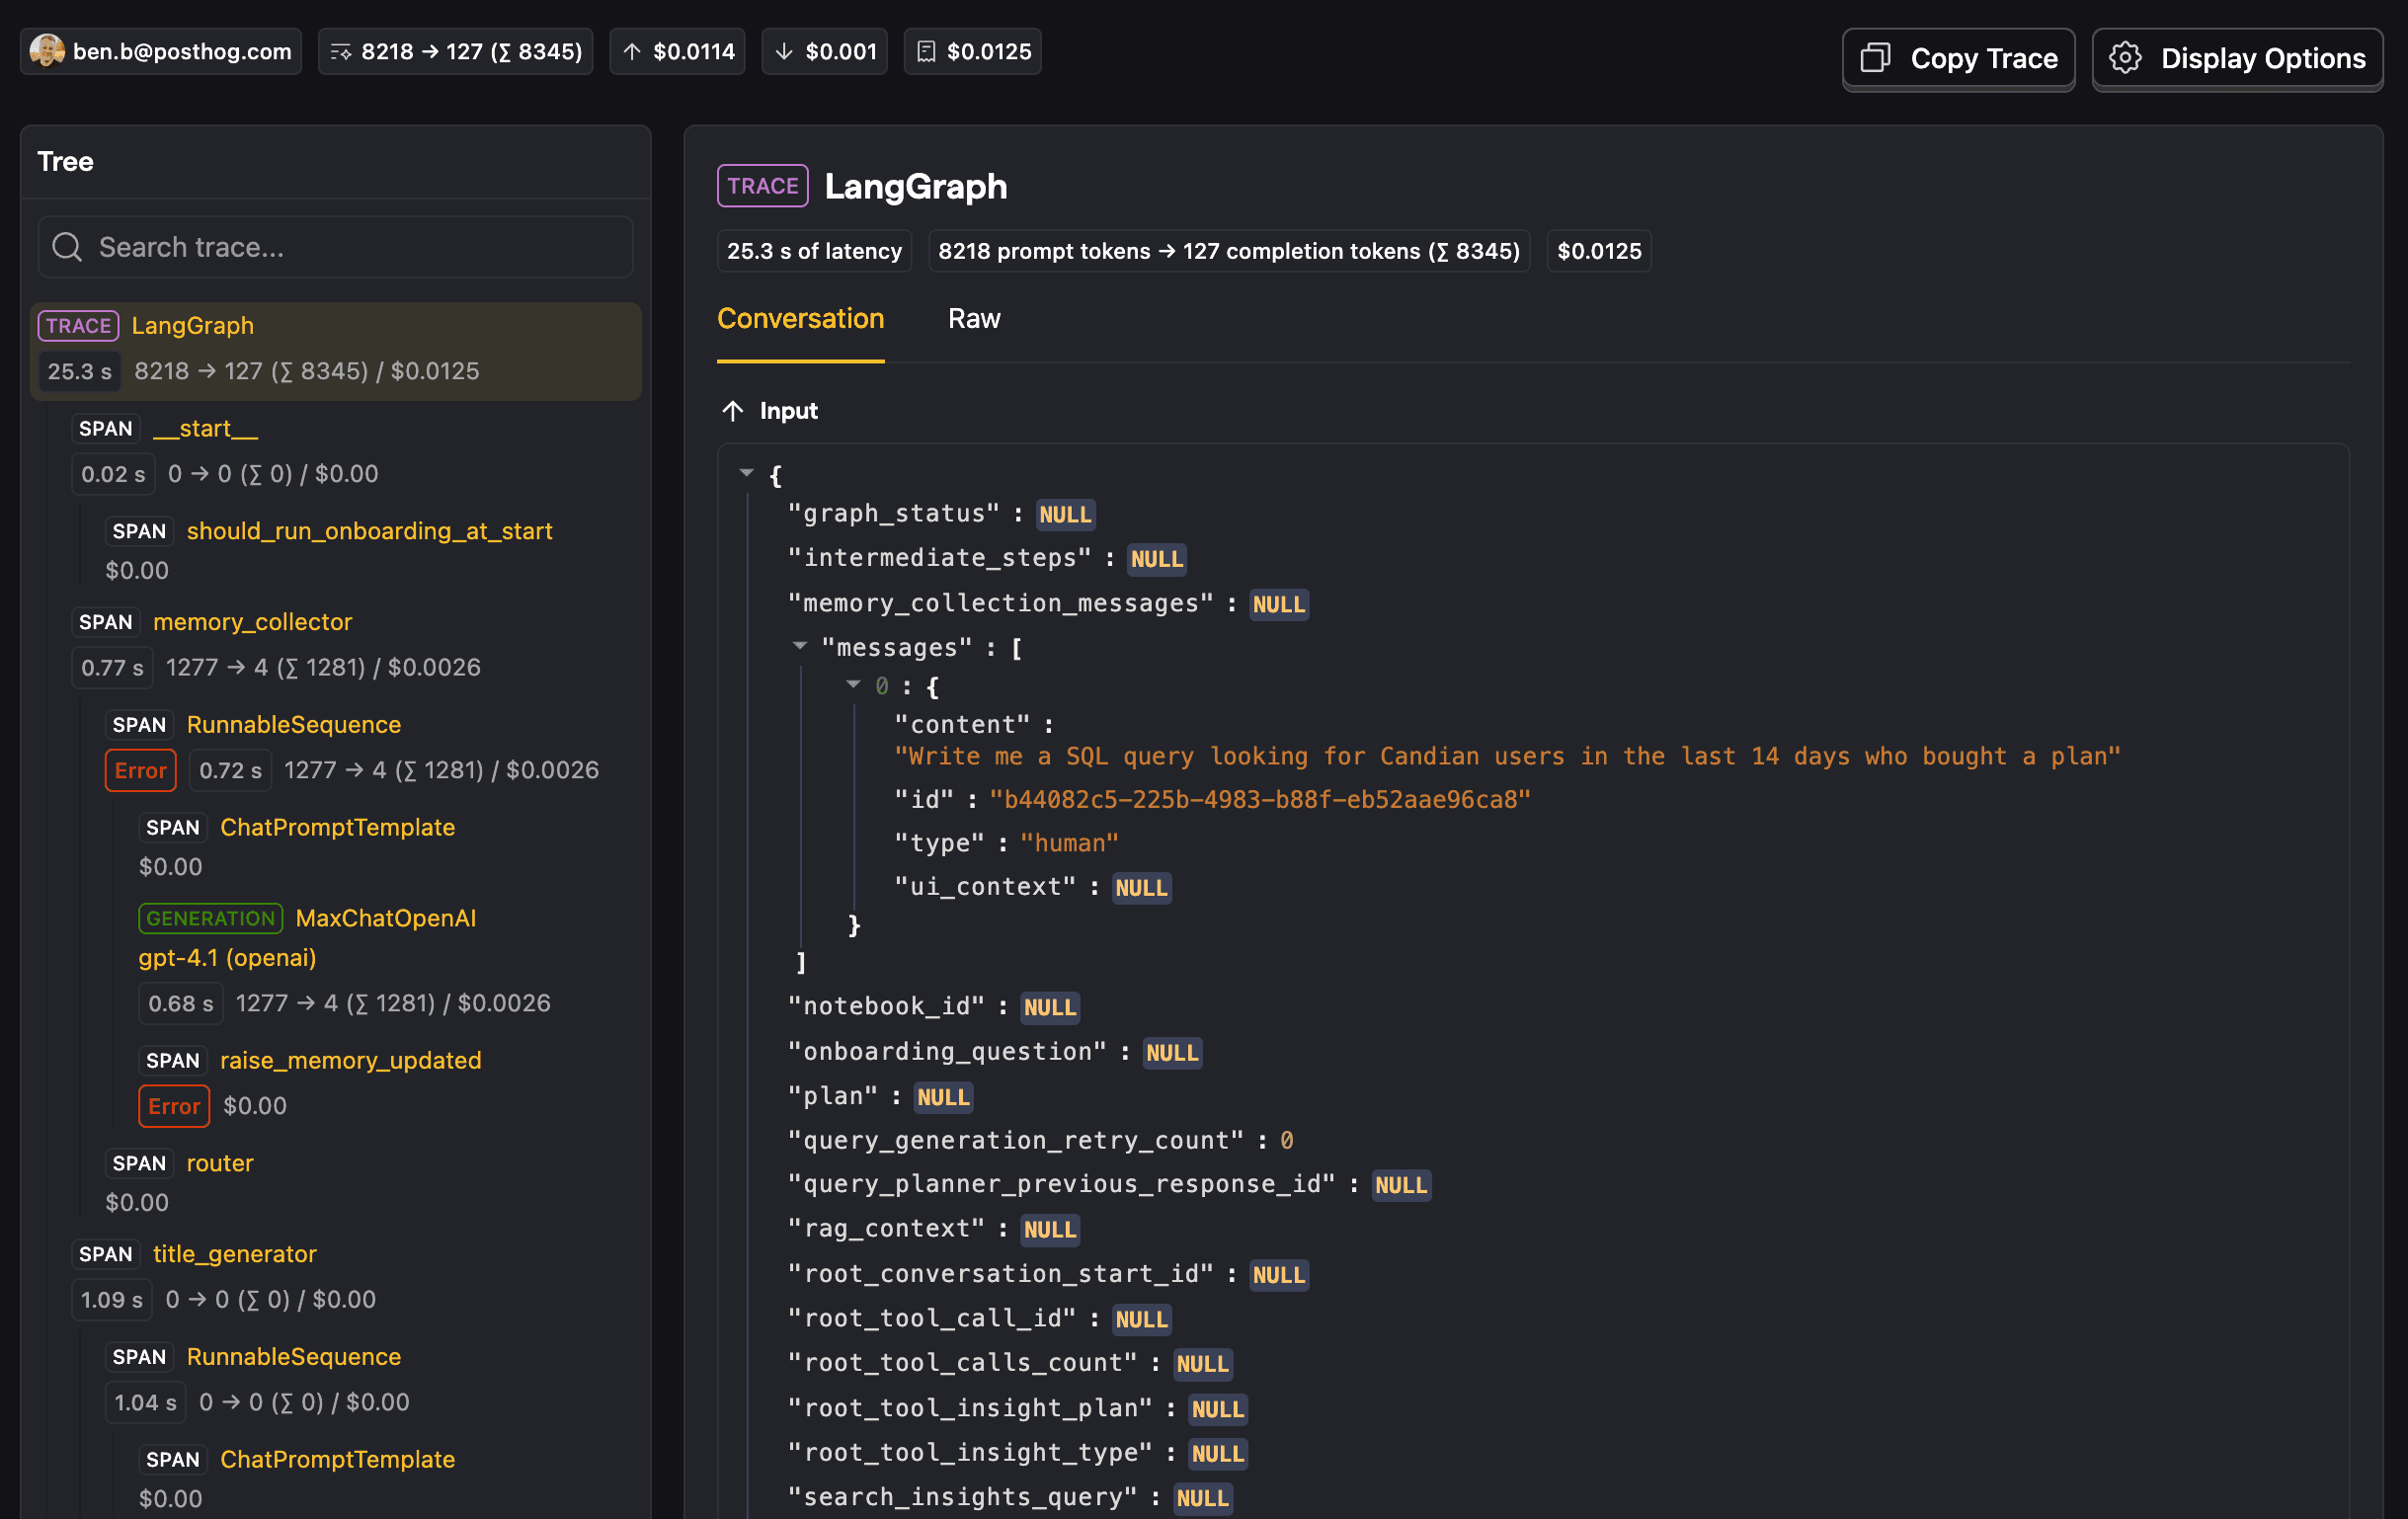
Trace timeline
Clicking on a trace opens a timeline of the interaction with all the generation and span events. The trace timeline enables you to see the entire conversation, profiling details, and the individual generations and spans.
Waterfall timeline
Above the trace tree, a waterfall timeline shows when each operation started and how long it ran. Each bar represents a generation, span, or embedding event, color-coded to match the tree view.
The waterfall helps you:
- See latency breakdown — Identify which operations took the longest and where time was spent waiting.
- Spot concurrency — Operations running in parallel appear on separate lanes. Parent-child connectors distinguish nested operations from concurrent siblings.
- Find errors at a glance — Errored operations display a red border on their bar.
- Navigate the trace — Click any bar to select the corresponding event in the tree view.
The time axis uses clock-friendly intervals (e.g. 15s, 30s, 1m, 2m). For deeply nested traces, the timeline caps at 6 visible lanes and scrolls vertically. You can collapse the timeline or expand it to full screen.
The waterfall also appears in the session view's steps drawer when inspecting a specific trace.
Conversation display options
When viewing a trace, you can control how conversation messages are displayed using the display options dropdown. The available options are:
- Expand all - Shows the full content of all messages in the conversation
- Expand user only - Expands only user messages, keeping system and assistant messages collapsed for easier scanning of user inputs
- Collapse except output and last input - The default view that shows the model's output and the most recent user input, keeping earlier messages collapsed
Tool calls
Traces display any tools called by the generations within them, shown as tags in the traces list. This makes it easy to see which conversations involved tool use at a glance.
Sentiment classification
PostHog can classify the sentiment of user messages in a trace as negative, neutral, or positive using a local model — no data is sent to third-party services. Sentiment runs as a sentiment analysis evaluation that you configure. Each trace gets an overall sentiment label and score, with a per-generation and per-message breakdown. See Sentiment classification for more details.
Search traces with PostHog AI
PostHog AI can search and analyze your LLM traces using natural language. When you're on an AI Observability page, PostHog AI automatically switches to its AI Observability mode, giving it access to tools for searching traces by date range, model, cost, error status, and other properties.
Example prompts you can try:
- "Show me recent LLM traces from the past week"
- "What are the most expensive LLM calls from today?"
- "Find traces with errors in the last 30 days"
- "What's happening in my most expensive trace?"
PostHog AI returns trace details including name, latency, cost, token counts, and error count. It can also read individual traces to provide a detailed summary of what happened.
AI event hierarchy
Traces consist of the following event hierarchy:
- (Optional) A session (
$ai_session_id) can group multiple traces together. - A trace (
$ai_trace_id) is the top-level required grouping for LLM events. - A trace can contain multiple spans and generations.
- A span can be the parent of other spans.
- A generation can be the child of a span or trace.
Event properties
A trace is a group that contains multiple spans, generations, and embeddings. Traces can be manually sent as events or appear as pseudo-events automatically created from child events.
Event name: $ai_trace
Core properties
| Property | Description |
|---|---|
$ai_trace_id | The trace ID (a UUID to group related AI events together) |
$ai_session_id | (Optional) Groups related traces together. Use this to organize traces by whatever grouping makes sense for your application (user sessions, workflows, conversations, or other logical boundaries). |
$ai_input_state | The input of the whole trace or any JSON-serializable state |
$ai_output_state | The output of the whole trace or any JSON-serializable state |
$ai_latency | (Optional) The latency of the trace in seconds |
$ai_span_name | (Optional) The name of the trace |
$ai_is_error | (Optional) Boolean to indicate if the trace encountered an error |
$ai_error | (Optional) The error message or object if the trace failed |
Pseudo-trace Events
When you send generation ($ai_generation), span ($ai_span), or embedding ($ai_embedding) events with a $ai_trace_id, PostHog automatically creates a pseudo-trace event that appears in the dashboard as a parent grouping. These pseudo-traces:
- Are not actual events in your data
- Automatically aggregate metrics from child events (latency, tokens, costs)
- Provide a hierarchical view of your AI operations
- Do not require sending an explicit
$ai_traceevent
This means you can either:
- Send explicit
$ai_traceevents to control the trace metadata - Let PostHog automatically create pseudo-traces from your generation/span events