

User activity
A customizable list of captured events
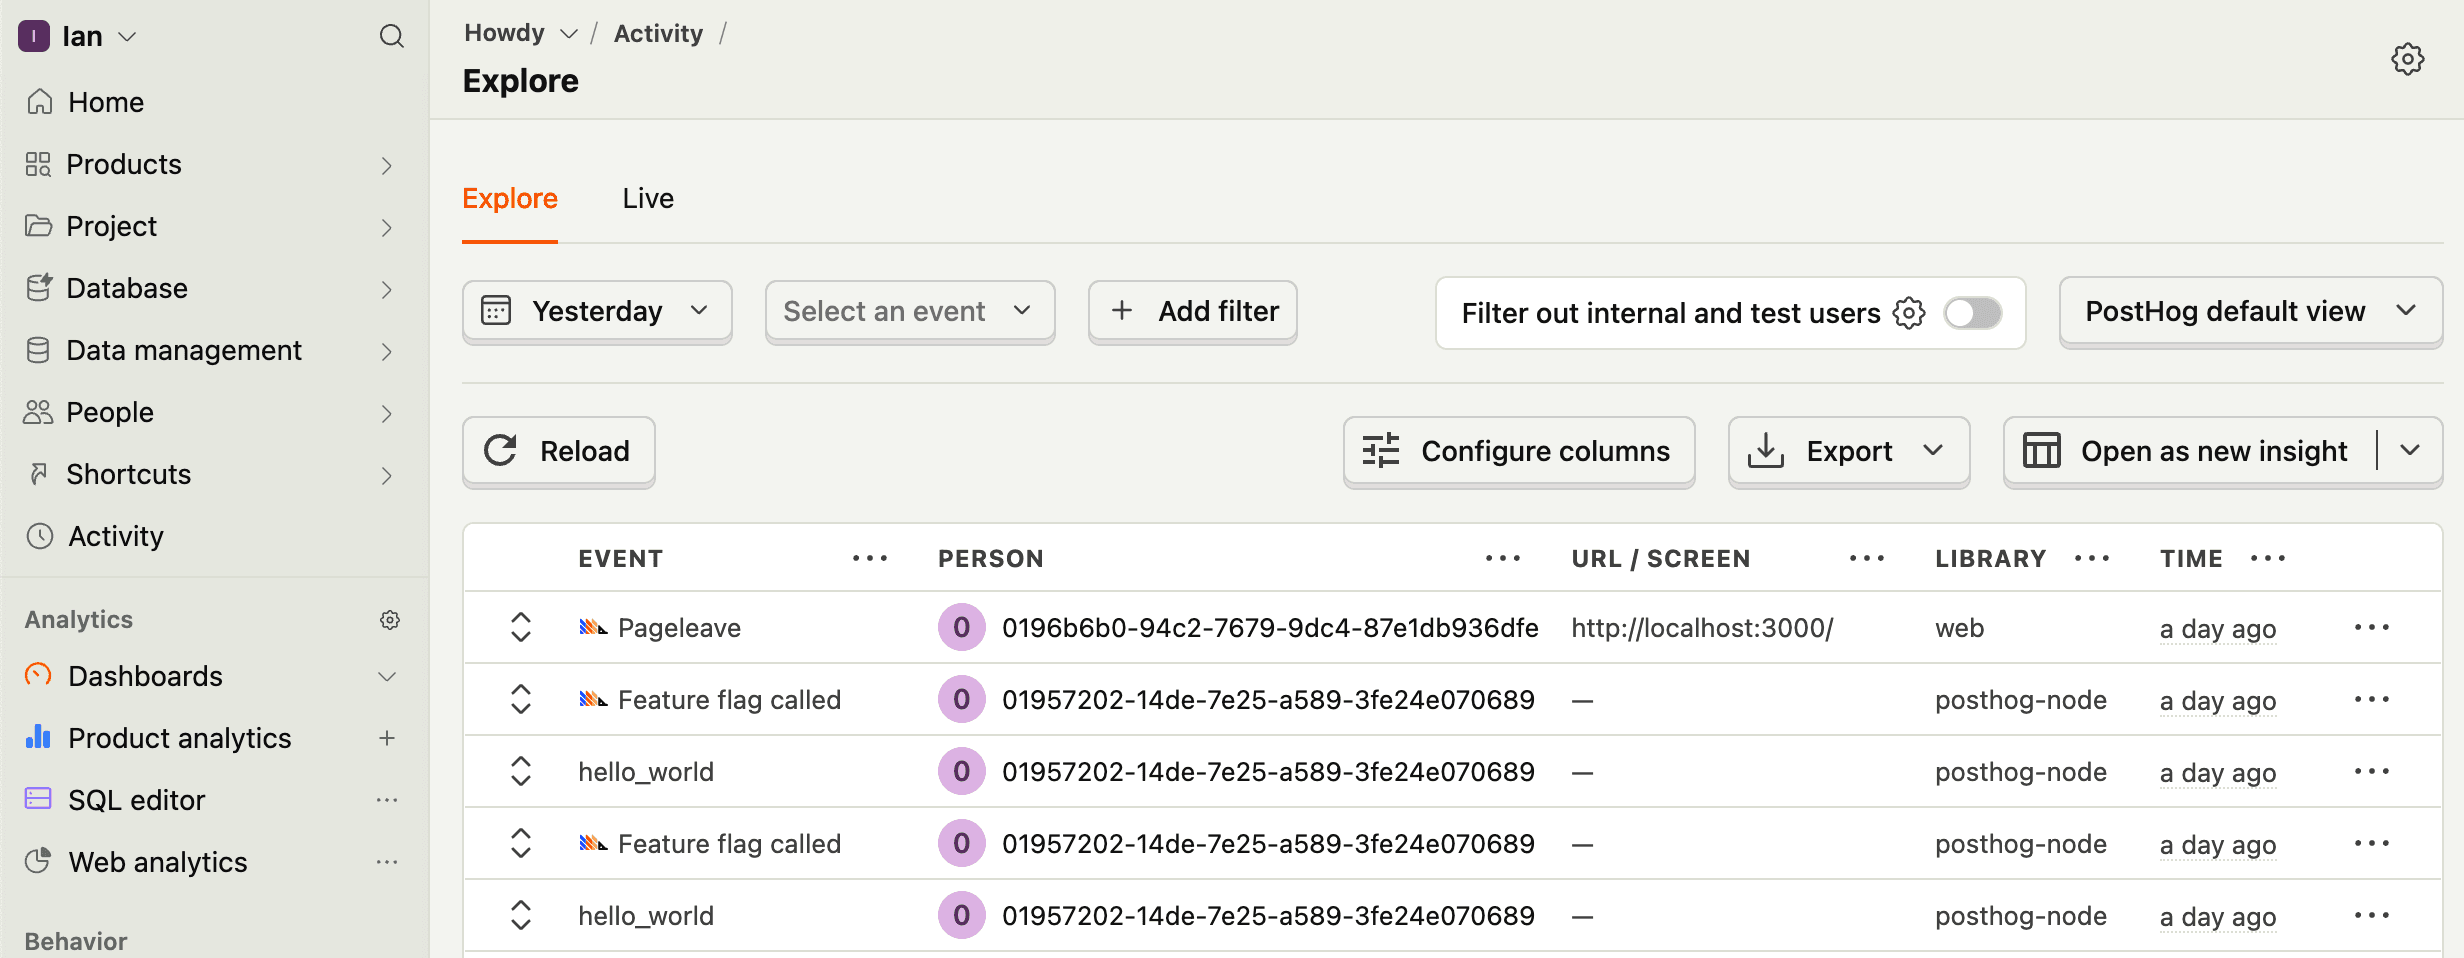
The activity tab is a customizable list of events that you've captured. It's great for checking events are being captured, debugging captured events, and being a jumping off point for further analysis. You can expand each event to see specific properties, metadata, raw JSON, and feature flags.
Key features
Flexible filtering and customization
Filter by date, event, properties, and more. Customize the columns shown including event properties, person properties, feature flags, and even SQL queries. Reorder columns and set your customization as the default for all project members.
Custom SQL expressions
Add SQL expressions for advanced customization. For example, to show an absolute timestamp like "Jul 16, 09:12:55", you can add an SQL expression like formatDateTime(toTimeZone($timestamp, 'America/Chicago'), '%b %d, %H:%i:%s').
Multiple activity views
Switch between different views to see your data in the most useful format:
- PostHog default: Shows a list of events with their person, URL or screen, library, and time
- Project default: Shows events with your configured columns
- Event count: Shows each event along with the number of times it's been captured
- Live: Shows a live feed of events as they are captured with currently active users
Live event streaming
Watch events flow in real-time as they are captured. See the number of currently active users, filter for specific events, or pause the stream to inspect events in detail.
Event debugging
Expand any event to inspect its properties, metadata, and raw JSON. Perfect for debugging your event tracking implementation and understanding what data is being captured.
Feature flag evaluation
See which feature flags were active when each event was captured. Understand how feature rollouts affect user behavior and debug flag targeting.